【Oracle CBO优化器】视图合并View Merging技术 _complex_view_merging & _simple_view_merging

Oracle CBo优化器中 各优化模块如下:

相关参数了


_complex_view_merging 和 _simple_view_merging

kkqvm  contains functions for merging simple SPJ, outer-joined SPJ, and complex (distinct or group by) views.


其中视图合并View Merging 主要分成2种:

  1. SPJ   Merge simple views that contains Select , Project and Join only (referred as SPJ views)
  2. CVM  views containing grouping, aggregation, distinct and outer join


•Recursively process any views referenced by the current view
•Either completely merge the view into the referencing query block
•OR simply move the definition of the view in-line into the referencing query block
SPJ View Merging

SPJ :

SELECT ENAME, DNAME FROM EMP E1, (

SELECT ENAME, DNAME,  SAL   FROM EMP E, DEPT D

WHERE E.DEPTNO = D.DEPTNO )  V

WHERE V.SAL >10000 and V.DNAME = E1.DNAME;


SELECT ENAME, DNAME FROM EMP E1

, EMP E, DEPT D

WHERE E.SAL >10000 and D.DNAME = E1.DNAME

AND E.DEPTNO = D.DEPTNO


•When processing the transformed query, the predicate ‘SAL>10000’ can be applied before the join of the EMP and the DEPT tables. This transformation can vastly improve query performance by reducing the amount of data to be joined.


Complex View Merging


CVM :


SELECT e1.ename,
  v.max_sal
FROM emp e1,
  ( SELECT e2.deptno, MAX(e2.sal) max_sal FROM emp e2 GROUP BY e2.deptno
  ) v
WHERE e1.deptno = v.deptno
AND e1.sal      = v.max_sal;

|

SELECT e1.ename,
  MAX(e2.sal) max_sal
FROM emp e1,
  emp e2
WHERE e1.deptno = e2.deptno
GROUP BY e2.deptno,
  e1.rowid,
  e1.ename,
  e1.sal
HAVING e1.sal=MAX(e2.sal)


KKQ View Merging  SPJ, outer-joined, lateral, and complex view merging.


MOs note:

Complex View Merging is an enhancement that allows views containing DISTINCT or GROUP BY constructs to be
merged.
View merging is an enhancement that allows view to be re-written as operations against the base table,
removing the view code from the equation and potentially relieving restrictions that may compromise performance on
some occasions.
Note that views containing set operators (UNION, UNION ALL, INTERSECT, MINUS), CONNECT BY and the ROWNUM
pseudocolumn cannot be merged.
These restrictions are in place to avoid cases where the resultant query from the merge would be impossible or
illegal, or would result in incorrect results.
For example, if a view containing ROWNUM was merged then the value of ROWNUM would be affected by the merge
and might produce different results.
View merging behavior can be manipulated with the NO_MERGE hint (all views) or with
Parameter:COMPLEX_VIEW_MERGING (underscore) (complex views).
From Oracle 9i the default behaviour is for complex view merging to be enabled (_COMPLEX_VIEW_MERGING = TRUE
)
The following are some examples of queries showing them being merged. Consider the following query:
select e.empno, V.memp
from
(select empno, max(empno) as memp from emp group by empno) V,
emp e
where V.empno = e.empno
and e.ename = 'SMITH';
The query is a join between an inline view called "V" and the "emp" table. With complex view merging off the plan is:
alter session set "_complex_view_merging" = false;
Execution Plan
----------------------------------------------------------
0 SELECT STATEMENT Optimizer=CHOOSE (Cost=6 Card=1 Bytes=34)
1 0 HASH JOIN (Cost=6 Card=1 Bytes=34)
2 1 TABLE ACCESS (FULL) OF 'EMP' (Cost=3 Card=1 Bytes=8)
3 1 VIEW (Cost=3 Card=14 Bytes=364)
4 3 SORT (GROUP BY) (Cost=3 Card=14 Bytes=42)
5 4 INDEX (FULL SCAN) OF 'EMPIX' (NON-UNIQUE) (Cost=2 Card=14 Bytes=42)
In the explain plan it can be seen that the join is between the outer table "EMP" and a VIEW.
The VIEW keyword means that the view in the query has not been merged and the 'group by' condition is applied
within this view.
If complex view merging is turned on, then the view can be merged:

alter session set "_complex_view_merging" = true;

Execution Plan
----------------------------------------------------------
0 SELECT STATEMENT Optimizer=CHOOSE (Cost=4 Card=1 Bytes=18)
1 0 SORT (GROUP BY) (Cost=4 Card=1 Bytes=18)
2 1 NESTED LOOPS (Cost=3 Card=1 Bytes=18)
3 2 TABLE ACCESS (FULL) OF 'EMP' (Cost=3 Card=1 Bytes=15)
4 2 INDEX (RANGE SCAN) OF 'EMPIX' (NON-UNIQUE) (Cost=1 Card=1 Bytes=3)
Note that the join is now between the 2 base tables whereas before it was between the outer table and a view
containing the inner table.
The VIEW keyword disappears completely because the view has been removed.
The advantages of this (among other things) are
the tables can now be directly joined to each other which may result in the availability of better access methods
the 'group by' can now be applied AFTER the join has occurred.
Since the join may restrict the amount of data presented to the group by,
this may mean that there is less data to group and thus may improve performance.
Also note that complex view merging may be applied to views that have been created as a result of subquery
unnesting if the original subquery is uncorrelated.

Know more about CBO Index Cost

近日偶读Joze Senegacnik(他是一名ACE)在OOW 2011上做的《Getting The Best From The Cost Based Optimizer》Presentation(这里可以下载),发现他总结的索引Unique Scan和Range Scan成本计算公式总结地很不错,贴出来共享:


Index Unique Scan Cost
INDEX UNIQUE SCAN COST = (BLEVEL (1-(OIC/100)) + 1) * (OICA/100)


Index Range Scan Cost
INDEX RANGE SCAN COST = (BLEVEL + FF*LFBL)*(1-(OIC/100))+ FF*CLUF)* (OICA/100)


formula does not include the CPU cost

  • BLEVEL = number of branch levels in index
  • add +1 for leaf block
  • FF = filtering factor – selectivity
  • LFBL = number of leaf blocks
  • CLUF = index clustering factor
  • OIC = optimizer_index_caching(default 0)
  • OICA = optimizer_index_cost_adj parameter(default=100)

Script:SQL调优健康检查脚本

以下脚本可以用于收集SQL调优的相关信息,包括统计信息、优化器参数等。

When executed for one SQL_ID, this script generates an HTML report with the results of a set of health-checks around the one SQL statement provided. Health-checks are performed over:

  • CBO Statistics for schema objects accessed by the one SQL statement being analyzed
  • CBO Parameters
  • CBO System Statistics
  • CBO Data Dictionary Statistics
  • CBO Fixed-objects Statistics


下载sqlhc脚本


示例输出HTML:


Know more about AWR Parse Statistics

Parse CPU to Parse Elapsed%是一个我们在分析AWR报告时常会看到的解析性能指标,该指标反映了 快照内解析CPU时间和总的解析时间的比值(Parse CPU Time/ Parse Elapsed Time); 若该指标水平很低,那么说明在整个解析过程中 实际在CPU上运算的时间是很短的,而主要的解析时间都耗费在各种其他非空闲的等待事件上了(如latch:shared pool,row cache lock之类等), 通过该指标我们可以了解是否有必要来调优Oracle的优化器Optimizer的解析(parse)工作, 调优的对象包括软、硬解析(soft and hard parse),理论上我们的目标是有极少的硬解析,少量的软解析,以及Parse CPU to Parse Elapsed% 接近于100% 相当于解析时都是在CPU上运算 而不等待, 所以Parse CPU to Parse Elapsed%也同时给我们以调优方向的启示。


Soft Parse %是AWR中另一个重要的解析指标,该指标反应了快照时间内 软解析次数 和 总解析次数 (soft+hard 软解析次数+硬解析次数)的比值,若该指标很低,那么说明了可能存在剧烈的hard parse硬解析,大量的硬解析会消耗更多的CPU时间片并产生解析争用(此时可以考虑使用cursor_sharing=FORCE); 理论上我们总是希望 Soft Parse % 接近于100%, 但并不是说100%的软解析就是最理想的解析状态,通过设置 session_cached_cursors参数和反复重用游标我们可以让解析来的更轻量级,即通俗所说的利用会话缓存游标实现的软软解析(soft soft parse)。


其他一些对于tuning SQL parse调优SQL解析有帮助的指标信息:


Reloads:


Library Cache Activity -> SQL Area reloads 信息,该指标反映了 游标被重新加载到shared pool共享池中的次数,引起reload重新装载的原因可能是共享游标失效Invalidation (失效可能由DDL等操作引起),也可能由shared pool共享池Free memory空闲内存过少导致sql reloads;reloads往往意味着本来可能已经被解析好的SQL语句,需要再次经历硬解析才能使用。


Library Cache Activity

  • “Pct Misses” should be very low
Namespace Get Requests Pct Miss Pin Requests Pct Miss Reloads Invali- dations
BODY 245 0.41 1,835 0.05 0 0
CLUSTER 665 0.00 155 0.00 0 0
DBLINK 1,020 0.00 0 0 0
EDITION 34 0.00 52 0.00 0 0
INDEX 308 3.90 244 10.66 14 0
OBJECT ID 273 100.00 0 0 0
QUEUE 5 0.00 762 0.00 0 0
RULESET 2 0.00 2 0.00 0 0
SCHEMA 1,077 0.00 0 0 0
SQL AREA 3,224 29.44 30,256 2.92 119 89
SUBSCRIPTION 1 0.00 1 0.00 0 0
TABLE/PROCEDURE 6,210 0.55 8,069 2.12 40 0
TRIGGER 182 0.00 188 0.00 0 0


High version Count:


在Oracle中同样的SQL语句可能被硬解析成不同的子游标(child cursor),一句SQL statement拥有过多的child cursor(例如超过50个子游标)往往说明游标无法被共享,若游标无法被共享使用那么只好每一次都再次硬解析和生成更多的子游标了,可以通过v$sql_shared_cursor来了解具体无法共享游标的原因。 实际引起SQL High Version Count的原因可能有很多,这里不再一一列举,特别需要注意的是以下2个Note涉及到的问题:


Note 296377.1 Handling and resolving unshared cursors/large version_counts Troubleshooting: High Version Count Issues
Note 261020.1 High Version Count with CURSOR_SHARING = SIMILAR or FORCE
Note 438755.1 High SQL Version Counts – Script to determine reason(s)
Note 377847.1 Unsafe Literals or Peeked Bind Variables


AWR中提供了SQL ordered by Version Count信息方便用户了解该指标


SQL ordered by Version Count

  • Only Statements with Version Count greater than 20 are displayed
Version Count Executions SQL Id SQL Module SQL Text
37 4 1nhkkuq1y13vm python.exe select * from www.askmac.cn
32 0 6mvfay19q3v4n SELECT COUNT(CLIENT_INFO) FROM…
30 0 dqbhc9r7gz0a5 SELECT DECODE(COUNT(CLIENT_INF…
27 24 2nk2p4h18rbwf MMON_SLAVE select tablespace_id, rfno, al…
26 24 a1xgxtssv5rrp MMON_SLAVE select * from www.askmac.cn
24 4 5s34t44u10q4g SELECT a.name task_name, nvl(e…
24 8 69k5bhm12sz98 SELECT dbin.instance_number, d…
24 4 c8gnrhxma4tas SELECT owner#, property FROM s…
24 4 gdn3ysuyssf82 SELECT advisor_id FROM sys.wri…
22 4 23nad9x295gkf SELECT (m.current_size / 10485…


具体的high version count诊断步骤:


1 select sql_text, hash_value,address from v$sqlarea where sql_id ='{sql id
from AWR>}'

2 select * from v$sql_shared_cursor where address = <address returned above>

3 SELECT sql_text,version_count,address FROM V$SQLAREA order by version_count desc;

4 From step 3 , take the sql with highest version count and put in below 

SELECT * FROM V$SQL_SHARED_CURSOR WHERE address = 'HERE';

5. 检查 参数 NLS_LENGTH_SEMANTICS  What is the value of NLS_LENGTH_SEMANTICS ?

SQL调优:带函数的谓词导致CBO Cardinality计算误差

今天处理了这样一问题,where条件中存在函数fun(date)<to_date(‘9999-01-01′,’YYYY-MM-DD’)这样的无实际意义谓词,导致CBO计算基数时cardinality远小于实际情况,导致优化器认为2个源数据集的基数都不大,从而选择了HASH JOIN Right SEMI+SORT ORDER BY的执行计划,但是由于实际基数远大于computed 计算值所以变成了大的数据集做HASH JOIN并全数据排序,而实际该SQL只要求返回几十行数据而已,使用NESTED LOOP SEMI JOIN可以立即返回排序的前20行数据。

这里就需要解释带函数的谓词时CBO如何计算基数,我们通过下面的例子来说明:


create or replace function check_date( RDATE in date)  return date is 
begin
IF rdate< to_date('2099-01-01','YYYY-MM-DD') then   return rdate;   ELSIF  rdate >=to_date('2099-01-01','YYYY-MM-DD') then 
 return to_date('2000-01-01');
 end if;
 end check_date;
 /

 SQL> select check_date (sysdate) from dual;

CHECK_DAT
---------
06-DEC-12

drop table tab1;

SQL> create table tab1 tablespace users as select * from dba_objects where rownum create view vtab1 as select object_id as id , object_name as name, object_type as type , check_date(created) cdata from tab1;

View created.

SQL> select count(distinct cdata) from vtab1;

COUNT(DISTINCTCDATA)
--------------------
                 130

SQL> exec dbms_stats.gather_table_stats('','TAB1', method_opt=>'FOR ALL COLUMNS SIZE 254');

PL/SQL procedure successfully completed.


因为我们指定收集了直方图所以若直接以”created”为条件查询时可以获得较好的计算基数

   SQL> select count(*) from tab1 where  created  >= to_date('0001-10-10','YYYY-MM-DD');

  COUNT(*)
----------
     10000

Execution Plan
----------------------------------------------------------
Plan hash value: 1117438016

---------------------------------------------------------------------------
| Id  | Operation          | Name | Rows  | Bytes | Cost (%CPU)| Time     |
---------------------------------------------------------------------------
|   0 | SELECT STATEMENT   |      |     1 |     8 |    40   (0)| 00:00:01 |
|   1 |  SORT AGGREGATE    |      |     1 |     8 |            |          |
|*  2 |   TABLE ACCESS FULL| TAB1 | 10000 | 80000 |    40   (0)| 00:00:01 |
---------------------------------------------------------------------------

Predicate Information (identified by operation id):
---------------------------------------------------

   2 - filter("CREATED">=TO_DATE(' 0001-10-10 00:00:00', 'syyyy-mm-dd
              hh24:mi:ss'))

Statistics
----------------------------------------------------------
          1  recursive calls
          0  db block gets
        133  consistent gets
          0  physical reads
          0  redo size
        526  bytes sent via SQL*Net to client
        523  bytes received via SQL*Net from client
          2  SQL*Net roundtrips to/from client
          0  sorts (memory)
          0  sorts (disk)
          1  rows processed


在以上查询中>= to_date(‘0001-10-10′,’YYYY-MM-DD’); 这样的过滤条件实际无意义,在直接使用 “created”列作为谓词的情况下,CBO可以获得很好的基数10000。


SQL> select * from TABLE(dbms_xplan.display_cursor(NULL,NULL,'ALLSTATS LAST'));

PLAN_TABLE_OUTPUT
--------------------------------------------------------------------------------------------------------------------------------------------------------------------------------------------------------
SQL_ID  6zy2k9dy4cv73, child number 0
-------------------------------------
select /*+ gather_plan_statistics */ count(*) from vtab1 where  cdata
>= to_date('0001-10-10','YYYY-MM-DD')

Plan hash value: 1117438016

-------------------------------------------------------------------------------------
| Id  | Operation          | Name | Starts | E-Rows | A-Rows |   A-Time   | Buffers |
-------------------------------------------------------------------------------------
|   0 | SELECT STATEMENT   |      |      1 |        |      1 |00:00:00.25 |     154 |
|   1 |  SORT AGGREGATE    |      |      1 |      1 |      1 |00:00:00.25 |     154 |
|*  2 |   TABLE ACCESS FULL| TAB1 |      1 |    500 |  10000 |00:00:00.31 |     154 |
-------------------------------------------------------------------------------------

Predicate Information (identified by operation id):
---------------------------------------------------

   2 - filter("CHECK_DATE"("CREATED")>=TO_DATE(' 0001-10-10 00:00:00',
              'syyyy-mm-dd hh24:mi:ss'))

21 rows selected.


通过gather_plan_statistics HINT,我们得到E-Rows 即CBO评估的基数,和 A-Rows实际的基数,可以看到这里E-Rows=500, 即在谓词左边存在使用内部函数或隐身装换的情况下,CBO无法通过现有统计信息的DISTINCT、DENSITY和HISTOGRAM获得较好的Cardinality,其基数总是统计信息中表的总行数/20,如上例中的 10000/20=500。

这就会引入不少的麻烦,因为开发人员有时候为了方便会在视图字段中嵌入自定义的函数,之后若在查询中使用该字段作为谓词条件,则可能导致CBO为相应表计算的基数偏少,是本身应当成本非常高的执行计划的COST变低,而容易被优化器选择。

对于上述问题可选的常见方案是若有这样问题的SQL较少则考虑加HINT或者SQL PROFILE,若较多还是需要考虑减少这种谓词左边有函数的现象。

implicit data_type conversion functions in Filter Predicates. Review Execution Plans.
If Filter Predicatesinclude unexpected INTERNAL_FUNCTION to perform an implicit data_type conversion,
be sure it is not preventing a column from being used as an Access Predicate.

How does dbms_stats default granularity AUTO Work?

dbms_stats收集统计信息包的默认粒度为AUTO,对于AUTO没有非常明确的解释,一般认为它会收集分区的统计信息,但不包含子分区subpartition。对于这种说明我们加以核实:


SQL> select * from v$version;

BANNER
----------------------------------------------------------------
Oracle Database 10g Enterprise Edition Release 10.2.0.5.0 - 64bi
PL/SQL Release 10.2.0.5.0 - Production
CORE    10.2.0.5.0      Production
TNS for Linux: Version 10.2.0.5.0 - Production
NLSRTL Version 10.2.0.5.0 - Production

SQL>  select dbms_stats.get_param('cascade') from dual;
   select dbms_stats.get_param('degree') from dual;

DBMS_STATS.GET_PARAM('CASCADE')
--------------------------------------------------------------------------------
DBMS_STATS.AUTO_CASCADE

SQL> 
DBMS_STATS.GET_PARAM('DEGREE')
--------------------------------------------------------------------------------
NULL

SQL>    select dbms_stats.get_param('estimate_percent') from dual;

DBMS_STATS.GET_PARAM('ESTIMATE_PERCENT')
--------------------------------------------------------------------------------
DBMS_STATS.AUTO_SAMPLE_SIZE

SQL>    select dbms_stats.get_param('method_opt') from dual;

DBMS_STATS.GET_PARAM('METHOD_OPT')
--------------------------------------------------------------------------------
FOR ALL COLUMNS SIZE AUTO

SQL>    select dbms_stats.get_param('no_invalidate') from dual;

DBMS_STATS.GET_PARAM('NO_INVALIDATE')
--------------------------------------------------------------------------------
DBMS_STATS.AUTO_INVALIDATE

SQL>    select dbms_stats.get_param('granularity') from dual;

DBMS_STATS.GET_PARAM('GRANULARITY')
--------------------------------------------------------------------------------
AUTO

CREATE TABLE composite_rng_hash (
cust_id     NUMBER(10), 
cust_name   VARCHAR2(25), 
amount_sold NUMBER(10,2), 
time_id     DATE)
PARTITION BY RANGE(time_id) 
SUBPARTITION BY HASH(cust_id)
SUBPARTITION TEMPLATE(
SUBPARTITION sp1 TABLESPACE users,
SUBPARTITION sp2 TABLESPACE users,
SUBPARTITION sp3 TABLESPACE users,
SUBPARTITION sp4 TABLESPACE users) (
PARTITION sales_pre05
VALUES LESS THAN (TO_DATE('01/01/2005','DD/MM/YYYY')),
PARTITION sales_2005 
VALUES LESS THAN(TO_DATE('01/01/2006','DD/MM/YYYY')),
PARTITION sales_2006
VALUES LESS THAN(TO_DATE('01/01/2007','DD/MM/YYYY')),
PARTITION sales_2007
VALUES LESS THAN(TO_DATE('01/01/2008','DD/MM/YYYY')),
PARTITION sales_2008 
VALUES LESS THAN(TO_DATE('01/01/2009','DD/MM/YYYY')),
PARTITION sales_future
VALUES LESS THAN(MAXVALUE));

Table created.

SQL> select num_rows , blocks from dba_tables where  table_name='COMPOSITE_RNG_HASH';

  NUM_ROWS     BLOCKS
---------- ----------

SQL> select partition_name,num_rows , blocks from dba_tab_partitions where  table_name='COMPOSITE_RNG_HASH';

PARTITION_NAME                   NUM_ROWS     BLOCKS
------------------------------ ---------- ----------
SALES_PRE05
SALES_2005
SALES_2006
SALES_2007
SALES_2008
SALES_FUTURE

SQL> select partition_name,SUBPARTITION_NAME,num_rows , blocks from dba_tab_subpartitions where  table_name='COMPOSITE_RNG_HASH';

PARTITION_NAME                 SUBPARTITION_NAME                NUM_ROWS     BLOCKS
------------------------------ ------------------------------ ---------- ----------
SALES_PRE05                    SALES_PRE05_SP4
SALES_PRE05                    SALES_PRE05_SP3
SALES_PRE05                    SALES_PRE05_SP2
SALES_PRE05                    SALES_PRE05_SP1
SALES_2005                     SALES_2005_SP4
SALES_2005                     SALES_2005_SP3
SALES_2005                     SALES_2005_SP2
SALES_2005                     SALES_2005_SP1
SALES_2006                     SALES_2006_SP4
SALES_2006                     SALES_2006_SP3
SALES_2006                     SALES_2006_SP2
SALES_2006                     SALES_2006_SP1
SALES_2007                     SALES_2007_SP4
SALES_2007                     SALES_2007_SP3
SALES_2007                     SALES_2007_SP2
SALES_2007                     SALES_2007_SP1
SALES_2008                     SALES_2008_SP4
SALES_2008                     SALES_2008_SP3
SALES_2008                     SALES_2008_SP2
SALES_2008                     SALES_2008_SP1
SALES_FUTURE                   SALES_FUTURE_SP4
SALES_FUTURE                   SALES_FUTURE_SP3
SALES_FUTURE                   SALES_FUTURE_SP2
SALES_FUTURE                   SALES_FUTURE_SP1

24 rows selected.

SQL> exec dbms_stats.gather_table_stats('SYS','COMPOSITE_RNG_HASH');

PL/SQL procedure successfully completed.

SQL> select num_rows , blocks from dba_tables where  table_name='COMPOSITE_RNG_HASH';

  NUM_ROWS     BLOCKS
---------- ----------
         0          0

SQL> 
SQL> 
SQL>  select partition_name,num_rows , blocks from dba_tab_partitions where  table_name='COMPOSITE_RNG_HASH';

PARTITION_NAME                   NUM_ROWS     BLOCKS
------------------------------ ---------- ----------
SALES_PRE05                             0          0
SALES_2005                              0          0
SALES_2006                              0          0
SALES_2007                              0          0
SALES_2008                              0          0
SALES_FUTURE                            0          0

  1* select partition_name,SUBPARTITION_NAME,num_rows , blocks from dba_tab_subpartitions where  table_name='COMPOSITE_RNG_HASH'
SQL> /

PARTITION_NAME                 SUBPARTITION_NAME                NUM_ROWS     BLOCKS
------------------------------ ------------------------------ ---------- ----------
SALES_PRE05                    SALES_PRE05_SP4
SALES_PRE05                    SALES_PRE05_SP3
SALES_PRE05                    SALES_PRE05_SP2
SALES_PRE05                    SALES_PRE05_SP1
SALES_2005                     SALES_2005_SP4
SALES_2005                     SALES_2005_SP3
SALES_2005                     SALES_2005_SP2
SALES_2005                     SALES_2005_SP1
SALES_2006                     SALES_2006_SP4
SALES_2006                     SALES_2006_SP3
SALES_2006                     SALES_2006_SP2
SALES_2006                     SALES_2006_SP1
SALES_2007                     SALES_2007_SP4
SALES_2007                     SALES_2007_SP3
SALES_2007                     SALES_2007_SP2
SALES_2007                     SALES_2007_SP1
SALES_2008                     SALES_2008_SP4
SALES_2008                     SALES_2008_SP3
SALES_2008                     SALES_2008_SP2
SALES_2008                     SALES_2008_SP1
SALES_FUTURE                   SALES_FUTURE_SP4
SALES_FUTURE                   SALES_FUTURE_SP3
SALES_FUTURE                   SALES_FUTURE_SP2
SALES_FUTURE                   SALES_FUTURE_SP1


以上证明了默认dbms_stats的GRANULARITY AUTO在常规情况下一般是收集分区统计信息, 而不收集子分区的统计信息。

dbms_stats.lock_table_stats对于没有统计信息的表分区同样有效

常见的分区表DDL如 split partition、add partition都会生成没有统计信息的表分区table partition,长期以来我对dbms_stats.lock_table_stats有一个错误的认识,即对于没有统计信息的分区,LOCK_STATS并不生效。 实际测试发现锁表统计信息对没有统计信息的分区同样有效,结果就是自动收集统计信息的作业不会收集这些实际没有统计信息的分区:


CREATE TABLE MacleanV
 nologging
      partition by range(object_id)
      (partition p1 values less than (99999) tablespace users,
      partition p2 values less than (maxvalue) tablespace users)
	as select * from dba_objects where rownum=0;  
	  
	  
SQL> insert into macleanV select * from dba_objects;

51029 rows created.

SQL> commit;

Commit complete.


SQL>  exec dbms_stats.gather_table_stats('SYS','MACLEANV');

PL/SQL procedure successfully completed.

SQL> select num_rows,blocks from dba_tables where table_name='MACLEANV';

  NUM_ROWS     BLOCKS
---------- ----------
     51029        748


SQL> select partition_name,num_rows,blocks from dba_tab_partitions where table_name='MACLEANV';

PARTITION_NAME                   NUM_ROWS     BLOCKS
------------------------------ ---------- ----------
P1                                  51029        748
P2                                      0          0


SQL> exec dbms_stats.lock_table_stats('SYS','MACLEANV');

PL/SQL procedure successfully completed.


SQL> exec dbms_stats.gather_table_stats('SYS','MACLEANV');
BEGIN dbms_stats.gather_table_stats('SYS','MACLEANV'); END;

*
ERROR at line 1:
ORA-20005: object statistics are locked (stattype = ALL)
ORA-06512: at "SYS.DBMS_STATS", line 15027
ORA-06512: at "SYS.DBMS_STATS", line 15049
ORA-06512: at line 1


SQL> alter table macleanv split partition p1 at (20001) into (partition p3, partition p4);

Table altered.

SQL> select partition_name,num_rows,blocks from dba_tab_partitions where table_name='MACLEANV';

PARTITION_NAME                   NUM_ROWS     BLOCKS
------------------------------ ---------- ----------
P4
P2                                      0          0
P3


SQL> exec DBMS_STATS.GATHER_DATABASE_STATS_JOB_PROC;

PL/SQL procedure successfully completed.

SQL> select partition_name,num_rows,blocks from dba_tab_partitions where table_name='MACLEANV';

PARTITION_NAME                   NUM_ROWS     BLOCKS
------------------------------ ---------- ----------
P2                                      0          0
P3
P4

SQL> exec  DBMS_STATS.GATHER_DATABASE_STATS;

PL/SQL procedure successfully completed.

SQL> select partition_name,num_rows,blocks from dba_tab_partitions where table_name='MACLEANV';

PARTITION_NAME                   NUM_ROWS     BLOCKS
------------------------------ ---------- ----------
P2                                      0          0
P3
P4

使用DBMS_STATS.LOCK_TABLE_STATS锁定相关统计信息
语句为:
EXECUTE DBMS_STATS.LOCK_TABLE_STATS (‘owner name’, ‘table name’);

查询锁定状态
SELECT stattype_locked FROM dba_tab_statistics

当锁定表的统计信息后,这个表相关的对象的统计信息也被锁定,比如列信息、直方图、索引的统计信息。

在锁定前,请在适当时刻对表的统计信息进行收集,并确认当前的统计信息是合适的。
在锁定后,请用刷新shared pool或grant/revoke等方法将表相关的SQL失效。

更多DBMS_STATS.LOCK_TABLE_STATS信息可以参考:

Preserving Statistics using DBMS_STATS.LOCK_TABLE_STATS [ID 283890.1]
ORA-7445 [kdapprv] Running dbms_stats.gather_table_stats or dbms_stats.lock_table_stats [ID 333377.1]
FAQ: Automatic Statistics Collection Jobs (10g and 11g) [ID 1233203.1]

v$session.sql_id为NULL或不准确的BUG

v$SESSION是我们常用的动态性能视图之一,其SQL_ID字段常用来检测会话当前执行的SQL语句,但在少数版本中V$SESSION的SQL_ID列可能不正常地显示SQL_ID,一般是在Session Active或执行Pl/SQL的时候SQL_ID为NULL,以下是部分相关的部分BUG列表:


BUG# Affected Version Symptom Fix Version
Bug 13068790 – the value of v$session.sql_id of active session is null [ID 13068790.8] 11.2.0.2.4 Patch Set Update
11.2.0.2.3 Patch Set Update
11.2.0.2.1 Patch Set Update
11.2.0.2
11.2.0.1
active session’s sql_id, sql_address may be null or 0 out while a recursive call is executing. 11.2.0.3 (Server Patch Set)
Bug 14393463 : IN V$SESSION, SQL_ID IS NOT NULL BUT STATUS IS INACTIVE 11.2.0.3 Abstract: IN V$SESSION, SQL_ID IS NOT NULL BUT STATUS IS INACTIVE No Workaround Now
Bug 11670241 : NULL V$SESSION.SQL_ID WHEN RUNNING SLOW SQL IN PL/SQL 11.2.0.1 In 11.2 (maybe also in 10g), when running a slow sql in pl/sql, we found that
v$session.sql_id will be null.  This is very inconvenient for
troubleshooting, because we cannot tell what sql is running by a session.
The only workaround seems to turn on sql_trace.
No Workaround Now
Bug 13089859 : THE VALUE OF V$SESSION.SQL_ID OF ACTIVE SESSION IS NULL 11.2.0.2 In some cases customer needs to find out SQL statements which are
executed in active sessions and tune them. So they needs the values of SQL_ID
in v$session.But that column occasionally have NULL values and then it make a difficulty
in tuning problematic SQL statements.
The following columns of v$session have NULL or zero (0) values even though
the session status is ACTIVE: SQL_ID, SQL_ADDRESS, SQL_HASH_VALUE,
SQL_EXEC_START, SQL_EXEC_ID.
12.1


另附V$SESSION视图相关的BUG列表:


NB Bug Fixed Description
13545355 12.1.0.0 V$SESSION.FIXED_TABLE_SEQUENCE may show negative values if DB up for a long time
10299006 11.2.0.2.GIPSU03, 11.2.0.3, 12.1.0.0 Excess oraagent.bin sessions in the database (in V$SESSION) / ORA-20
9339310 11.2.0.2, 12.1.0.0 V$SESSION may not show correct SQL_ID
P 7214679 11.2.0.2, 12.1.0.0 OSUSER in V$SESSION is missing extended characters
13068790 11.2.0.3 the value of v$session.sql_id of active session is null
8655331 11.2.0.2 V$SESSION.COMMAND has wrong code for commands >= 128
6994490 10.2.0.5, 11.2.0.1 Multibyte characters garbled in V$SESSION client information
6993310 11.2.0.1 V$SESSION.CLIENT_INFO cannot be set to NULL with fix for bug 5915741
6661393 10.2.0.5, 11.1.0.7, 11.2.0.1 Setting CLIENT_INFO does not affect CLIENT_IDENTIFIER
8674660 10.2.0.5, 11.1.0.7 DIAG process gets PGA memory corruption or ORA-600[kjzhablar:idx] or dump in RAC env
5928612 10.2.0.4, 11.1.0.7 V$SESSION SQL_ADDRESS / SQL_HASH_VALUE not set for DBMS_JOBs
5915741 10.2.0.5, 11.1.0.6 ORA-29275 selecting from V$SESSION with multibyte DB
5246867 10.2.0.3, 11.1.0.6 V$SESSION.PROGRAM is not populated properly for JDBC Thin
5140631 10.2.0.4, 11.1.0.6 V$SESSION.sql_address not set by DBMS_SCHEDULER
5078627 10.2.0.4, 11.1.0.6 Audit sessionid is zero for jobs invoked by job scheduler
5010879 10.2.0.4, 11.1.0.6 V$SESSION slow and does not show any BLOCKING_SESSION column data
4507211 10.2.0.3, 11.1.0.6 Thin JDBC connection properties terminal not reflected in V$SESSION
4496189 9.2.0.8, 10.2.0.2, 11.1.0.6 V$SESSION.PROGRAM can contain partial MULTIBYTE characters
4493741 10.2.0.4, 11.1.0.6 Cannot see SQL_TEXT for procedure calls from EXECUTE IMMEDIATE
4383610 10.1.0.5, 10.2.0.2, 11.1.0.6 application info attributes are not translated correctly in utf16 environment
3735857 10.2.0.2, 11.1.0.6 V$SESSION.OSUSER not populated for JDBC clients
9322219 10.2.0.5.5 Session dump with stack memcpy <- kjzhgigblk in RAC env
5884519 10.2.0.4 V$SESSION is slow with fix for bug 5010879
5481650 10.2.0.4 GV$SESSION.blocking_session has incorrect value
4393134 10.2.0.1 OracleConnectionCachImpl does not set connection properties (eg V$SESSION.PROGRAM)
3258390 9.2.0.6, 10.1.0.4, 10.2.0.1 V$SESSION.SCHEMANAME may return wrong value in PLSQL of another user
2740805 9.2.0.5, 10.1.0.2 V$SESSION.OS_USER set incorrectly if client uses RADIUS
P 2661173 9.2.0.4, 10.1.0.2 Linux: V$SESSION.PROGRAM shows full path instead of executable name
P 2628258 9.2.0.3, 10.1.0.2 Win: Trailing “\0” added to MACHINE column of V$SESSION
2123156 9.0.1.4, 9.2.0.2, 10.1.0.2 FAILOVER: V$SESSION.FAILOVER_METHOD / FAILOVER _TYPE may be wrong for second connection
2106360 9.2.0.2, 10.1.0.2 MODULE (V$SESSION/V$SQL) should default to the PROGRAM name
P 2026123 8.1.7.3, 9.0.1.4, 9.2.0.1 V$SESSION.PROGRAM displays ‘?’ for OCI clients
1326191 9.2.0.1 V$SESSION.OSUSER is always ‘ORACLE’ using JDBC Thin
1249631 8.1.7.3, 9.0.1.3, 9.2.0.1 V$SESSION.SQL_ADDRESS is not cleared when a cursor is unmapped
1540012 9.0.1.0 V$SESSION and V$SESSTAT “IDLE TIME” may not increment
1500535 8.1.7.1.B, 9.0.1.0 V$SESSION.PROCESS not set by the THIN driver
1290469 8.1.6.3.J, 8.1.7.0 V$SESSION does not show useful information for JDBC thin clients
1237128 8.1.7.0 V$SESSION.PROGRAM may not contain a value
889678 8.1.7.0 V$SESSION had short sizes for TERMINAL and MACHINE fields
P 759086 7.3.4.4 SP2: Program column in V$SESSION shows up as ? (broken fix)

Oracle Enterprise Manager 12c 新特性:实时Real-Time Addm

在Oracle Enterprise Manager 12c中引入了Real-Time addm的新特性。 DBA可以直接从EM界面上启动实时ADDM(Automatic Database Diagnostic Monitor )信息收集, 也叫做Emergency ADDM。


Emergency ADDM adds performance diagnostics for databases suffering from severe performance problems. Real-time ADDM. You can connect to the database and investigate what is going on when you cannot connect to the database because it is hanging on


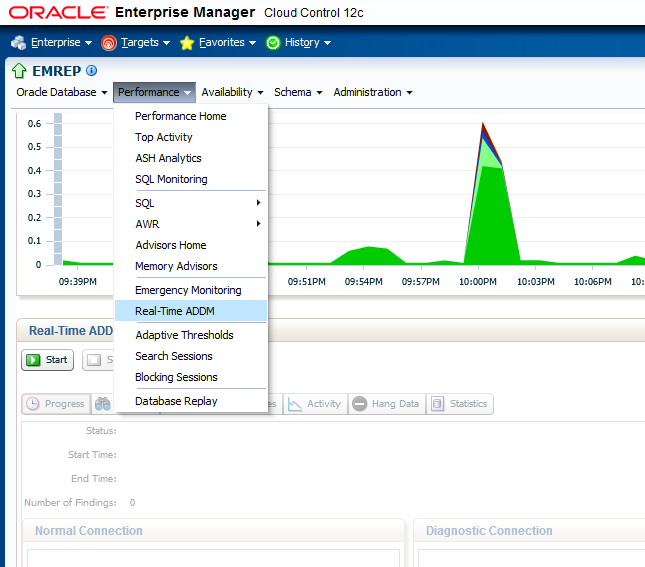
登录EM 12c后Target -> Database -> 选择指定的数据库 -> Performance -> Real-Time Addm:


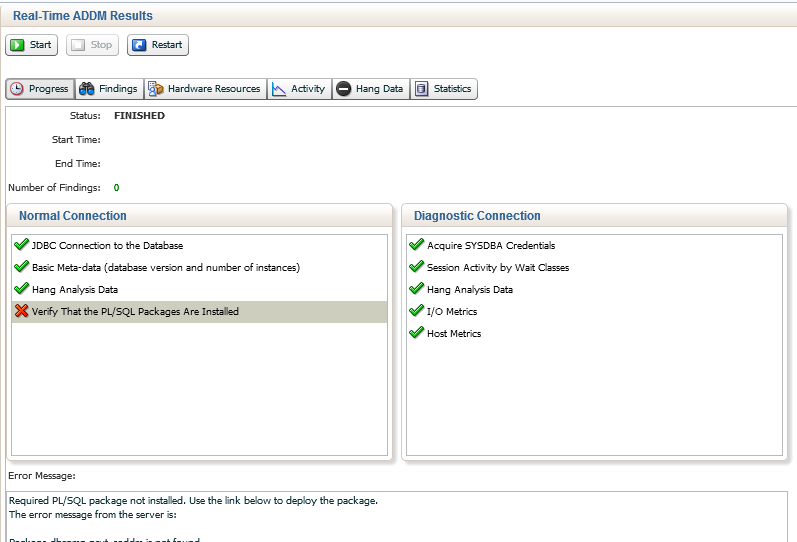
进入”Real-Time ADDM”后点选start按钮,第一次使用会出现”Required PL/SQL package not installed. Use the link below to deploy the package. The error message from the server is:Package dbsnmp.prvt_eaddm is not found” 的错误:


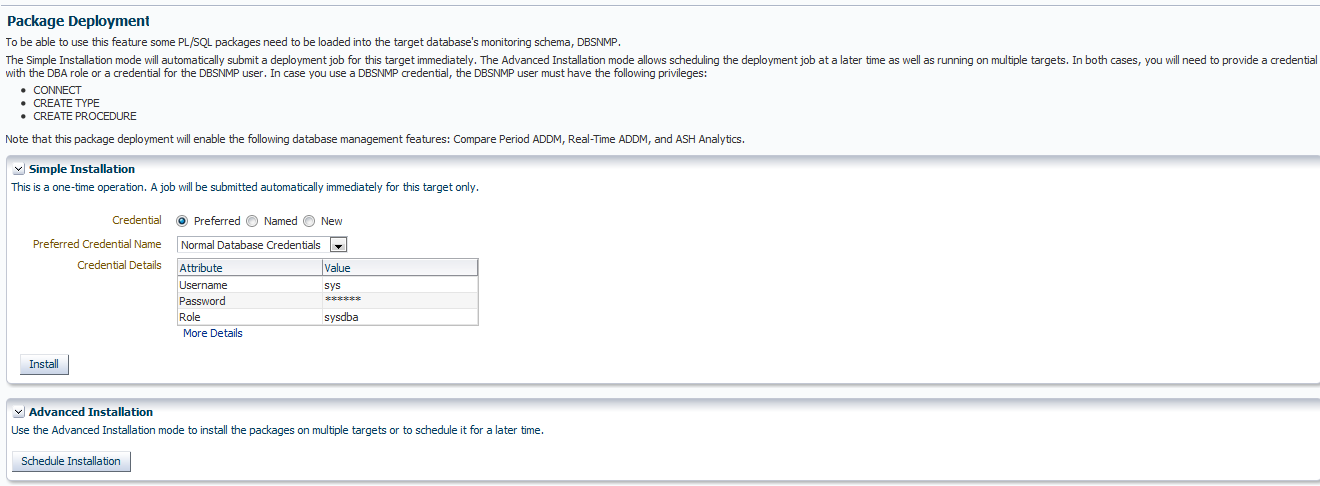
使用Real-Time Addm要求预安装dbsnmp.prvt_eaddm包,点选下方的PL/SQL Package Deployment链接,进入Package Deployment页面,选择合适的身份认证,并install。


进入Job Run: DATABASE MANAGEMENT PL/SQL DEPLOYMENT JOB页面等待作业完成。

以测试为目的登录数据库并运行以下消耗CPU的SQL语句(不要用在生产库!):


 select count(1) from obj$,obj$,obj$;


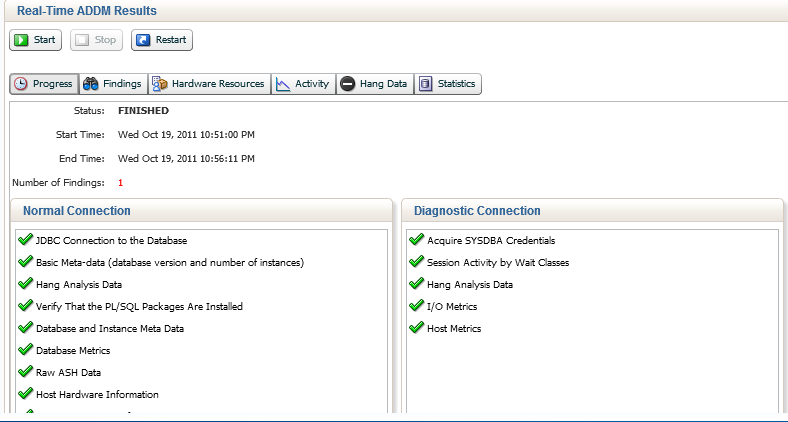
回到”Real-Time ADDM”页面再次点击start , 等待一段时间后会自动stop,如下图:


Real-Time Addm有所发现,这里的Number of finding =1 ,点击Findings 可以看到Prority、Performance Impact、Finding Details等信息:


当出现服务进程hang的情况,例如进程因”enq: TM contention”  队列锁而长久等待,则可以从hang data栏获取hang analysis Final Blocker 和 blocking session的信息, 找出阻塞的源头:


上图中列出了Blocker chains ,一定程度上可以替代hanganalyze dump。

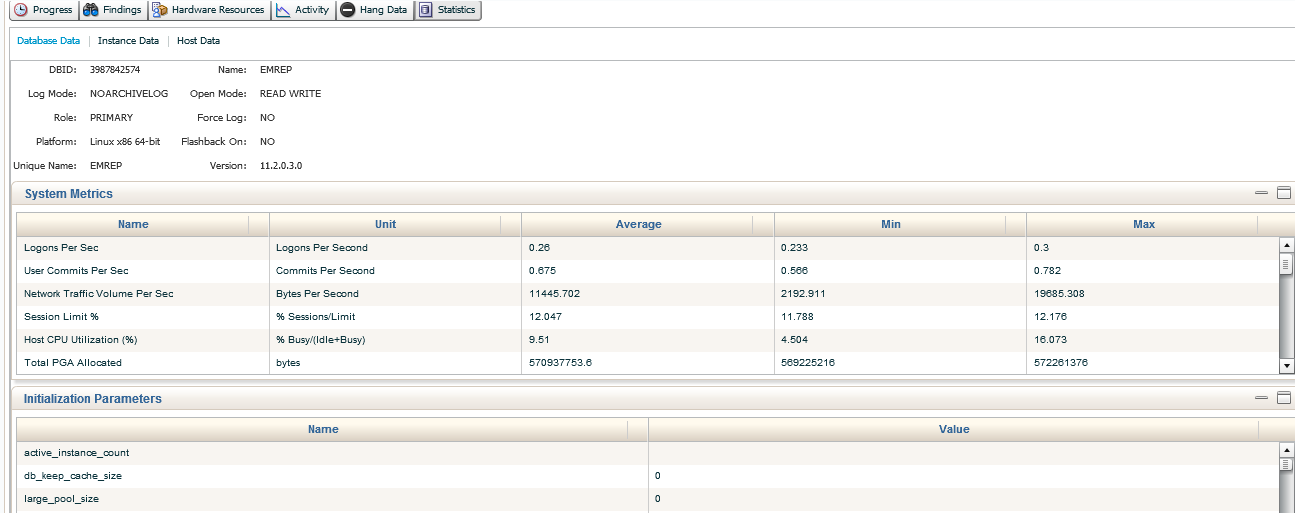
statistics栏给出了实例的一些属性和近期的系统度量system metrics:


Real-Time Addm可以帮助我们快速定位性能和挂起hang问题,而且给出初步的分析,这要比我们使用脚本一步步查来的快捷多了。

CBO为什么不走索引?

原帖是Itpub上的网友提出一个CBO为什么不走索引的问题, 该问题的演示如下:


SQL> create table maclean1 as select * from dba_objects;

Table created.

SQL> update maclean1 set status='INVALID' where owner='MACLEAN';

2 rows updated.

SQL> commit;                                       

Commit complete.

SQL> create index ind_maclean1 on maclean1(status);

Index created.

SQL> exec dbms_stats.gather_table_stats('SYS','MACLEAN1',cascade=>true);

PL/SQL procedure successfully completed.

SQL> explain plan for select * from maclean1 where status='INVALID';

Explained.

SQL> set linesize 140 pagesize 1400
SQL> select * from table(dbms_xplan.display());

PLAN_TABLE_OUTPUT
---------------------------------------------------------------------------
Plan hash value: 987568083

------------------------------------------------------------------------------
| Id  | Operation         | Name     | Rows  | Bytes | Cost (%CPU)| Time     |
------------------------------------------------------------------------------
|   0 | SELECT STATEMENT  |          | 11320 |  1028K|    85   (0)| 00:00:02 |
|*  1 |  TABLE ACCESS FULL| MACLEAN1 | 11320 |  1028K|    85   (0)| 00:00:02 |
------------------------------------------------------------------------------

Predicate Information (identified by operation id):
---------------------------------------------------

   1 - filter("STATUS"='INVALID')

13 rows selected.

10053 trace 

Access path analysis for MACLEAN1
***************************************
SINGLE TABLE ACCESS PATH
  Single Table Cardinality Estimation for MACLEAN1[MACLEAN1]
  Column (#10): STATUS(
    AvgLen: 7 NDV: 2 Nulls: 0 Density: 0.500000
  Table: MACLEAN1  Alias: MACLEAN1
    Card: Original: 22639.000000  Rounded: 11320  Computed: 11319.50  Non Adjusted: 11319.50
  Access Path: TableScan
    Cost:  85.33  Resp: 85.33  Degree: 0
      Cost_io: 85.00  Cost_cpu: 11935345
      Resp_io: 85.00  Resp_cpu: 11935345
  Access Path: index (AllEqRange)
    Index: IND_MACLEAN1
    resc_io: 185.00  resc_cpu: 8449916
    ix_sel: 0.500000  ix_sel_with_filters: 0.500000
    Cost: 185.24  Resp: 185.24  Degree: 1
  Best:: AccessPath: TableScan
         Cost: 85.33  Degree: 1  Resp: 85.33  Card: 11319.50  Bytes: 0

可以从以上10053中看到因为没有直方图存在,所以这里的Density = 0.5 是从 1/ NDV 算得的
也就意味着粗糙的统计信息显示STATUS='INVALID"的数据行占总行数的一半,
所以优化器选择做全表扫描是有道理的


以上符合”STATUS”=’INVALID’ condition的只有2行,且status列上建有索引,同时也使用了dbms_stats包收集表和索引上的统计信息,照理说CBO因该选择INDEX Range ind_maclean1,而避免全表扫描,但实际优化器opitimizer没有这样做。


实际上这个问题和统计信息收集时是否收集直方图有关系,只要收集了直方图,那么优化器就会了解到status=’INVALID’条件仅有少量的card满足,具有良好的选择性:


[oracle@vrh4 ~]$ sqlplus  / as sysdba

SQL*Plus: Release 11.2.0.2.0 Production on Mon Oct 17 19:15:45 2011

Copyright (c) 1982, 2010, Oracle.  All rights reserved.

Connected to:
Oracle Database 11g Enterprise Edition Release 11.2.0.2.0 - 64bit Production
With the Partitioning, OLAP, Data Mining and Real Application Testing options

SQL> select * from v$version;

BANNER
--------------------------------------------------------------------------------
Oracle Database 11g Enterprise Edition Release 11.2.0.2.0 - 64bit Production
PL/SQL Release 11.2.0.2.0 - Production
CORE    11.2.0.2.0      Production
TNS for Linux: Version 11.2.0.2.0 - Production
NLSRTL Version 11.2.0.2.0 - Production

SQL> show parameter optimizer_fea

NAME                                 TYPE        VALUE
------------------------------------ ----------- ------------------------------
optimizer_features_enable            string      11.2.0.2

SQL> select * from global_name;

GLOBAL_NAME
--------------------------------------------------------------------------------
www.askmac.cn  & www.askmac.cn

SQL> drop table maclean;

Table dropped.

SQL>  create table maclean as select * from dba_objects;

Table created.

SQL> update maclean set status='INVALID' where owner='MACLEAN';

2 rows updated.

SQL>  commit;

Commit complete.

SQL> create index ind_maclean on maclean(status);

Index created.

SQL> exec dbms_stats.gather_table_stats('SYS','MACLEAN',cascade=>true, method_opt=>'FOR ALL COLUMNS SIZE 2');

PL/SQL procedure successfully completed.


这里我们仅收集2个bucket的直方图, 就足以让优化器做出正确选择了。

得益于Quest公司的Guy Harrison所写的一个列出FREQUENCY直方图信息的脚本,以下为该脚本:


rem
rem Generate a histogram of data distribution in a column as recorded
rem  in dba_tab_histograms
rem
rem Guy Harrison Jan 2010 : www.guyharrison.net
rem
rem hexstr function is from From http://asktom.oracle.com/pls/asktom/f?p=100:11:0::::P11_QUESTION_ID:707586567563 

set pagesize 10000
set lines 120
set verify off

col char_value format a10 heading "Endpoint|value"
col bucket_count format 99,999,999 heading "bucket|count"
col pct format 999.99 heading "Pct"
col pct_of_max format a62 heading "Pct of|Max value"
rem col endpoint_value format 9999999999999 heading "endpoint|value" 

CREATE OR REPLACE FUNCTION hexstr (p_number IN NUMBER)
    RETURN VARCHAR2
AS
    l_str      LONG := TO_CHAR (p_number, 'fm' || RPAD ('x', 50, 'x'));
    l_return   VARCHAR2 (4000);
BEGIN
    WHILE (l_str IS NOT NULL)
    LOOP
        l_return := l_return || CHR (TO_NUMBER (SUBSTR (l_str, 1, 2), 'xx'));
        l_str := SUBSTR (l_str, 3);
    END LOOP;

    RETURN (SUBSTR (l_return, 1, 6));
END;
/

WITH hist_data AS (
SELECT endpoint_value,endpoint_actual_value,
       NVL(LAG (endpoint_value) OVER (ORDER BY endpoint_value),' ') prev_value,
       endpoint_number,
       endpoint_number,
       endpoint_number
       - NVL (LAG (endpoint_number) OVER (ORDER BY endpoint_value), 0)
           bucket_count
FROM dba_tab_histograms
JOIN dba_tab_col_statistics USING (owner, table_name,column_name)
WHERE     owner = '&owner'
      AND table_name = '&table'
      AND column_name = '&column'
      AND histogram='FREQUENCY')
SELECT nvl(endpoint_actual_value,endpoint_value) endpoint_value ,
       bucket_count,
       ROUND(bucket_count*100/SUM(bucket_count) OVER(),2) PCT,
       RPAD(' ',ROUND(bucket_count*50/MAX(bucket_count) OVER()),'*') pct_of_max
  FROM hist_data;

WITH hist_data AS (
SELECT endpoint_value,endpoint_actual_value,
       NVL(LAG (endpoint_value) OVER (ORDER BY endpoint_value),' ') prev_value,
       endpoint_number,
       endpoint_number,
       endpoint_number
       - NVL (LAG (endpoint_number) OVER (ORDER BY endpoint_value), 0)
           bucket_count
FROM dba_tab_histograms
JOIN dba_tab_col_statistics USING (owner, table_name,column_name)
WHERE     owner = '&owner'
      AND table_name = '&table'
      AND column_name = '&column'
      AND histogram='FREQUENCY')
SELECT hexstr(endpoint_value) char_value,
       bucket_count,
       ROUND(bucket_count*100/SUM(bucket_count) OVER(),2) PCT,
       RPAD(' ',ROUND(bucket_count*50/MAX(bucket_count) OVER()),'*') pct_of_max
  FROM hist_data
ORDER BY endpoint_value;


使用该脚本,我们可以更直观的感受FREQUENCY直方图信息:


这里dbms_stats 包收集到的STATUS=’INVALID’ bucket count=9 percent = 0.04 ,可以和之后的10053 trace中的信息对比以下:


SQL> explain plan for select * from maclean where status='INVALID';

Explained.

SQL>  select * from table(dbms_xplan.display());

PLAN_TABLE_OUTPUT
-------------------------------------
Plan hash value: 3087014066

-------------------------------------------------------------------------------------------
| Id  | Operation                   | Name        | Rows  | Bytes | Cost (%CPU)| Time     |
-------------------------------------------------------------------------------------------
|   0 | SELECT STATEMENT            |             |     9 |   837 |     2   (0)| 00:00:01 |
|   1 |  TABLE ACCESS BY INDEX ROWID| MACLEAN     |     9 |   837 |     2   (0)| 00:00:01 |
|*  2 |   INDEX RANGE SCAN          | IND_MACLEAN |     9 |       |     1   (0)| 00:00:01 |
-------------------------------------------------------------------------------------------

Predicate Information (identified by operation id):
---------------------------------------------------

   2 - access("STATUS"='INVALID')

以上可以看到只要收集了直方图CBO就会认识到满足STATUS=’INVALID’的cardnality很少 , 该条件具有良好的选择性 ,使用index range scan而非Full table scan。

我们进一步来看看有直方图情况下的10053 trace:

SQL> alter system flush shared_pool;

System altered.

SQL> oradebug setmypid;
Statement processed.

SQL> oradebug event 10053 trace name context forever ,level 1;
Statement processed.

SQL> explain plan for select * from maclean where status='INVALID';

Explained.

SINGLE TABLE ACCESS PATH
  Single Table Cardinality Estimation for MACLEAN[MACLEAN]
  Column (#10):
    NewDensity:0.000199, OldDensity:0.000022 BktCnt:22640, PopBktCnt:22640, PopValCnt:2, NDV:2

  这里的NewDensity= bucket_count / SUM(bucket_count) /2

   Column (#10): STATUS(
    AvgLen: 7 NDV: 2 Nulls: 0 Density: 0.000199
    Histogram: Freq  #Bkts: 2  UncompBkts: 22640  EndPtVals: 2
  Table: MACLEAN  Alias: MACLEAN
 Card: Original: 22640.000000 Rounded: 9 Computed: 9.00 Non Adjusted: 9.00
  Access Path: TableScan
    Cost:  85.30  Resp: 85.30  Degree: 0
      Cost_io: 85.00  Cost_cpu: 10804625
      Resp_io: 85.00  Resp_cpu: 10804625
  Access Path: index (AllEqRange)
    Index: IND_MACLEAN
    resc_io: 2.00  resc_cpu: 20763
    ix_sel: 0.000398  ix_sel_with_filters: 0.000398
    Cost: 2.00  Resp: 2.00  Degree: 1
  Best:: AccessPath: IndexRange
  Index: IND_MACLEAN
         Cost: 2.00  Degree: 1  Resp: 2.00  Card: 9.00  Bytes: 0


上例中我们手动指定收集2 bucket的直方图后CBO优化器才能做出正确的选择,那么岂不是要人工干预来收集列的统计信息,默认的dbms_stats.DEFAULT_METHOD_OPT方式不能为我们提供有效的直方图收集方式吗?

实际上dbms_stats的自动决定直方图的收集与否及收集的桶数受到col_usage$基本中列充当predicate的历史记录影像,关于col_usage$详见<了解你所不知道的SMON功能(四):维护col_usage$字典基表>


假设在统计表上信息的dbms_stats存储过程执行之前,col_usage$中已经存有表上相关列充当predicate的记录,那么dbms_stats存储过程就会考虑为该列收集直方图信息, 如:


SQL> drop table maclean;

Table dropped.

SQL>  create table maclean as select * from dba_objects;

Table created.

SQL> update maclean set status='INVALID' where owner='MACLEAN';

2 rows updated.

SQL> commit;

Commit complete.

SQL> create index ind_maclean on maclean(status);

Index created.

使用dbms_stats默认method_opt收集maclean表

SQL> exec dbms_stats.gather_table_stats('SYS','MACLEAN');

PL/SQL procedure successfully completed.

@histogram.sql 

Enter value for owner: SYS
old  12:    WHERE owner = '&owner'
new  12:    WHERE owner = 'SYS'
Enter value for table: MACLEAN
old  13:      AND table_name = '&table'
new  13:      AND table_name = 'MACLEAN'
Enter value for column: STATUS
old  14:      AND column_name = '&column'
new  14:      AND column_name = 'STATUS'

no rows selected

因为缺少col_usage$列使用信息,所以依然没有收集status列的直方图

    declare
    begin
    for i in 1..500 loop
	execute immediate ' alter system flush shared_pool';
	DBMS_STATS.FLUSH_DATABASE_MONITORING_INFO;
    execute immediate 'select count(*)  from maclean where status=''INVALID'' ' ;
    end loop;
    end;
    /

PL/SQL procedure successfully completed.

SQL> select obj# from obj$ where name='MACLEAN';

      OBJ#
----------
     97215
SQL> select * from  col_usage$ where  OBJ#=97215;

       OBJ#    INTCOL# EQUALITY_PREDS EQUIJOIN_PREDS NONEQUIJOIN_PREDS RANGE_PREDS LIKE_PREDS NULL_PREDS TIMESTAMP
---------- ---------- -------------- -------------- ----------------- ----------- ---------- ---------- ---------
     97215          1              1              0                 0           0          0          0 17-OCT-11
     97215         10            499              0                 0           0          0          0 17-OCT-11

SQL> exec dbms_stats.gather_table_stats('SYS','MACLEAN');

PL/SQL procedure successfully completed.

@histogram.sql 

Enter value for owner: SYS
Enter value for table: MACLEAN
Enter value for column: STATUS

Endpoint        bucket         Pct of
value            count     Pct Max value
---------- ----------- ------- --------------------------------------------------------------
INVALI               2     .04
VALIC3           5,453   99.96  *************************************************

沪ICP备14014813号-2

沪公网安备 31010802001379号