推荐一款性能诊断工具-Membai

Marcus Mönnig是一名居住在德国汉堡的Oracle Database顾问及DBA,他开发了一款基于Windows平台的面向Oracle DBA和Consultant的图形化工具-Membai,该软件侧重于性能分析。

Membai在现有的Windows主流操作系统包括XP、2003和win7上都可以流畅工作。唯一的先决条件是需要预装Full Oracle Client客户端软件。Membai所支持的Oracle数据库版本包括从9.2到最新的11.2,因为主要是在10.2上测试,所以部分功能可能在9.2中无法正常工作。

Membai的特性包括:

  • Instant access to important database views vital for DBAs and consultants
  • Retrieved data in Mumbai can be slices and dices in various ways (sorting, filtering, grouping, group arithmetic, etc.)
  • Visualization of data in graphs
  • SQL console window inducing support for bind variables
  • Executions plans for SQL statements from cursor cache, through EXPLAIN PLAN or through DBMS_XPLAN from the Mumbai SQL console window
  • Retrieve alert.log and trace files from the database server to Mumbai and process/analyze them there.
  • Start and stop 10046 traces for any session or process and trace the statements from your SQL console session with just a few clicks
  • Powerful 10046 trace file viewer if you need to dig into the details of a TKPROF or OraSRP report. OraSRP reports can be generated from within Mumbai.
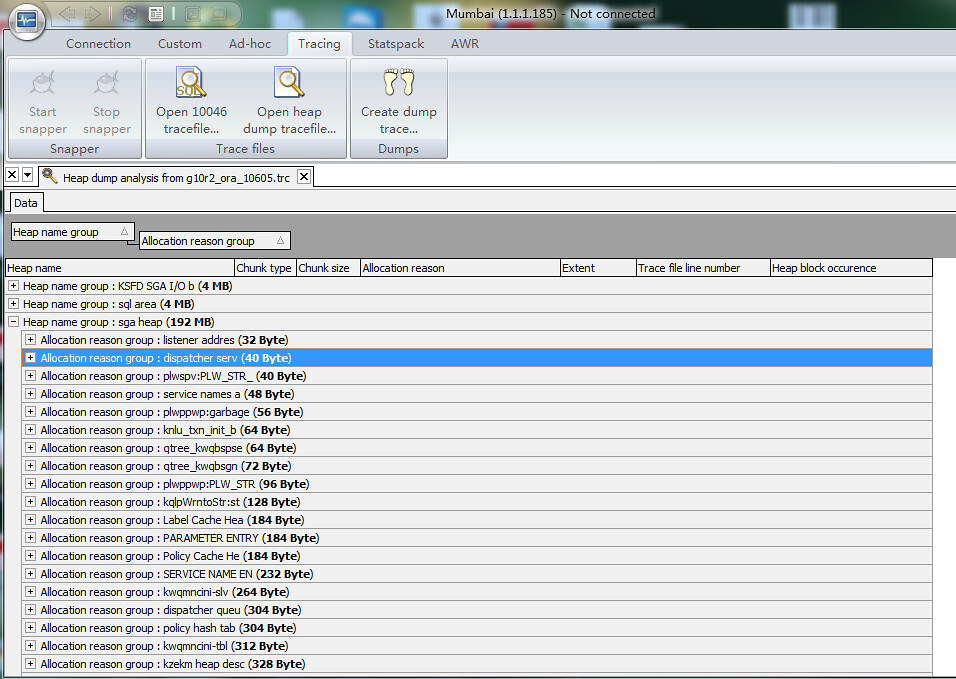
  • Heap dump analyzer that aggregates data from trace files
  • Instant connections to DB server with RDP, putty or WinSCP
  • Run snapper from within Mumbai and let Mumbai visualize the data collected by snapper
  • Analyze Statspack or AWR data, e.g. to find interesting intervals for further analysis

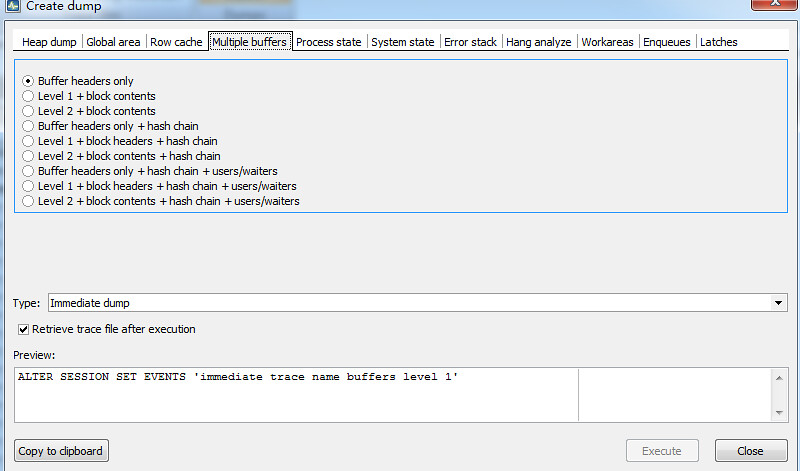
值得一提的是Membai提供了heapdump analyze的功能,这对于经常和heapdump打交道的Oracle Consultant来说是一个福音,此外它同时还提供create dump trace的功能,该功能基本涵盖了主要的Oracle转储和诊断事件,有了它我们无需在忘记dump/trace语句时再去翻手册了。其heapdump analyze和create dump trace功能见下图:

heapdump_analyze

create_dump_function

Membai最新的版本是1.1.1.185 (released 17 Apr. 2011): Download here


Oracle常用诊断事件清单

事件 说明 例子
Event 10013 – Monitor Transaction Recovery 在Startup时跟踪事务恢复 ALTER SESSION SET EVENTS ‘10013 trace name context forever, level 1’;
Event 10015 – Dump Undo Segment Headers- 在事务恢复后做Dump回退段头信息 ALTER SESSION SET EVENTS ‘10015 trace name context forever, level 1’;
Event 10032 – Dump Sort Statistics Dump排序的统计信息 ALTER SESSION SET EVENTS ‘10032 trace name context forever, level 10’;
Event 10033 – Dump Sort Intermediate Run Statistics 排序过程中,内存排序区和临时表空间的交互情况 ALTER SESSION SET EVENTS ‘10033 trace name context forever, level 10’;
Event 10045 – Trace Free List Management Operations FREELIST的管理操作 ALTER SESSION SET EVENTS ‘10045 trace name context forever, level 1’;
Event 10046 – Enable SQL Statement Trace 跟踪SQL,有执行计划,邦定变量和等待的统计信息,level 12最详细。 ALTER SESSION SET EVENTS ‘10046 trace name context forever, level 12’; 

LEVEL定义如下:

1:SQL 语句,执行计划和执行状态

4:1的内容加上绑定变量信息

8:1的信息加上等待事件信息

12:1+4+8

Event 10053 – Dump Optimizer Decisions 在分析SQL语句时,Dump出优化器所做的选择,级别level 1最详细 ALTER SESSION SET EVENTS ‘10053 trace name context forever, level 1’; 

LEVEL定义如下:

1:状态和估算信息

2:只显示估算信息

Event 10060 – Dump Predicates DUMP SQL语句中的断语信息。需要在需要DUMP的用户下创建以下表 

CREATE TABLE kkoipt_table
(c1 INTEGER,

c2 VARCHAR2(80));

断语信息会写入该表

ALTER SESSION SET EVENTS ‘10060 trace name context forever, level 1’;
Event 10065 – Restrict Library Cache Dump Output for State Object Dumps 限制对象状态DUMP的时候LIBRARY CACHE信息的详细程度
1 Address of library object only 

2 As level 1 plus library object lock details

3 As level 2 plus library object handle and library object

缺省是LEVEL 3

ALTER SESSION SET EVENTS ‘10065 trace name context forever, level level’;
Event 10079 – Dump SQL*Net Statistics- Dump SQL*NeT的统计信息 ALTER SESSION SET EVENTS ‘10079 trace name context forever, level 2’;
Event 10081 – Trace High Water Mark Changes HWM的改变 ALTER SESSION SET EVENTS ‘10081 trace name context forever, level 1’;
Event 10104 – Dump Hash Join Statistics HASH JOIN的统计信息 ALTER SESSION SET EVENTS ‘10104 trace name context forever, level 10’;
Event 10128 – Dump Partition Pruning Information 分区表调整信息 ALTER SESSION SET EVENTS ‘10128 trace name context forever, level level’; 

Level取值:

1   Dump pruning descriptor for each partitioned object

0x0002 Dump partition iterators

0x0004 Dump optimizer decisions about partition-wise joins

0x0008 Dump ROWID range scan pruning information

在9.0.1或者后面的版本,在level 2后还需要建立如下的表:

CREATE TABLE kkpap_pruning

(

partition_count    NUMBER,

iterator           VARCHAR2(32),

partition_level    VARCHAR2(32),

order_pt         VARCHAR2(12),

call_time        VARCHAR2(12),

part#             NUMBER,

subp#              NUMBER,

abs#               NUMBER

);

事件 说明 例子
Event 10200 – Dump Consistent Reads DUMP一致读的信息 ALTER SESSION SET EVENTS ‘10200 trace name context forever, level 1’;
Event 10201 – Dump Consistent Read Undo Application DUMP一致性读涉及UNDO信息的内容 ALTER SESSION SET EVENTS ‘10201 trace name context forever, level 1’;
Event 10220 – Dump Changes to Undo Header Dump出Undo头信息的改变 ALTER SESSION SET EVENTS ‘10220 trace name context forever, level 1’;
Event 10221 – Dump Undo Changes Dump Undo的改变 ALTER SESSION SET EVENTS ‘10221 trace name context forever, level 7’;
Event 10224 – Dump Index Block Splits / Deletes 索引块的分裂和D删除信息 ALTER SESSION SET EVENTS ‘10224 trace name context forever, level 1’;
Event 10225 – Dump Changes to Dictionary Managed Extents DUMP字段管理的扩展变化 ALTER SESSION SET EVENTS ‘10225 trace name context forever, level 1’;
Event 10231 全表扫描时跳过坏块,在有坏块的情况下做数据拯救时很有用 ALTER SYSTEM SET EVENTS ‘10231 trace name context forever,level 10’;
Event 10241 – Dump Remote SQL Execution 远程SQL语句的执行信息 ALTER SESSION SET EVENTS ‘10241 trace name context forever, level 1’;
Event 10246 – Trace PMON Process 跟踪PMON进程 只能修改参数,不能用ALTER SYSTEM 

event = “10246 trace name context forever, level 1”

Event 10248 – Trace Dispatcher Processes 跟踪DISPATCHER的工作情况 event = “10248 trace name context forever, level 10”
Event 10249 – Trace Shared Server (MTS) Processes- 跟踪共享服务器的工作情况 event = “10249 trace name context forever, level 10”
Event 10270 – Debug Shared Cursors 跟踪共享CURSORS的情况 event = “10270 trace name context forever, level 10”
Event 10299 – Debug Prefetching 跟踪表数据块和索引数据块的PREFETCHING event = “10299 trace name context forever, level 1”
Event 10357 – Debug Direct Path ALTER SESSION SET EVENTS ‘10357 trace name context forever, level 1’;
Event 10390 – Dump Parallel Execution Slave Statistics 跟踪并行操作中的SLAVE的状态 ALTER SESSION SET EVENTS ‘10390 trace name context forever, level 1;
Event 10391-Dump Parallel Execution Granule Allocation 跟踪并行操作的粒度 ALTER SESSION SET EVENTS ‘10391 trace name context forever, level 2’;
Event 10393 – Dump Parallel Execution Statistics 跟踪并行操作的状态(每个SLAVE单独列出状态) ALTER SESSION SET EVENTS ‘10393 trace name context forever, level 1’;
Event 10500 – Trace SMON Process 跟踪SMON进程 event = “10500 trace name context forever, level 1”
Event 10608 – Trace Bitmap Index Creation 跟踪BITMAP索引创建的详细过程 ALTER SESSION SET EVENTS ‘10608 trace name context forever, level 10’;
Event 10704 – Trace Enqueues 跟踪锁的使用情况 ALTER SESSION SET EVENTS ‘10704 trace name context forever, level 1’;
Event 10706 – Trace Global Enqueue Manipulation 跟踪全局锁的使用情况 ALTER SESSION SET EVENTS ‘10706 trace name context forever, level 1’;
Event 10708 – Trace RAC Buffer Cache 跟踪RAC环境下的BUFFER CACHE ALTER SESSION SET EVENTS ‘10708 trace name context forever, level 10’;
事件 说明 例子
Event 10710 – Trace Bitmap Index Access 跟踪位图索引的访问情况 ALTER SESSION SET EVENTS ‘10710 trace name context forever, level 1’;
Event 10711 – Trace Bitmap Index Merge Operation 跟踪位图索引合并操作 ALTER SESSION SET EVENTS ‘10711 trace name context forever, level 1’;
Event 10712 – Trace Bitmap Index OR Operation 跟踪位图索引或操作情况 ALTER SESSION SET EVENTS ‘10712 trace name context forever, level 1’;
Event 10713 – Trace Bitmap Index AND Operation 跟踪位图索引与操作 ALTER SESSION SET EVENTS ‘10713 trace name context forever, level 1’;
Event 10714 – Trace Bitmap Index MINUS Operation 跟踪位图索引minus操作 ALTER SESSION SET EVENTS ‘10714 trace name context forever, level 1’;
Event 10715 – Trace Bitmap Index Conversion to ROWIDs Operation 跟踪位图索引转换ROWID操作 ALTER SESSION SET EVENTS ‘10715 trace name context forever, level 1’;
Event 10716 – Trace Bitmap Index Compress/Decompress 跟踪位图索引压缩和解压缩情况 ALTER SESSION SET EVENTS ‘10716 trace name context forever, level 1’;
Event 10717 – Trace Bitmap Index Compaction ALTER SESSION SET EVENTS ‘10717 trace name context forever, level 1’;
Event 10719 – Trace Bitmap Index DML 跟踪位图索引列的DML操作(引起位图索引改变的DML操作) ALTER SESSION SET EVENTS ‘10719 trace name context forever, level 1’;
Event 10730 – Trace Fine Grained Access Predicates 跟踪细粒度审计的断语 ALTER SESSION SET EVENTS ‘10730 trace name context forever, level 1’;
Event 10731 – Trace CURSOR Statements 跟踪CURSOR的语句情况 ALTER SESSION SET EVENTS ‘10731 trace name context forever, level level’; 

LEVEL定义

1     Print parent query and subquery

2     Print subquery only

Event 10928 – Trace PL/SQL Execution 跟踪PL/SQL执行情况 ALTER SESSION SET EVENTS ‘10928 trace name context forever, level 1’;
Event 10938 – Dump PL/SQL Execution Statistics 跟踪PL/SQL执行状态。使用前需要执行rdbms/admin下的tracetab.sql ALTER SESSION SET EVENTS ‘10938 trace name context forever, level 1’;
flush_cache 刷新BUFFER CACHE ALTER SESSION SET EVENTS ‘immediate trace name flush_cache’;
DROP_SEGMENTS 手工删除临时段。当这些临时段无法自动清除的时候可以手工清除 alter session set events ‘immediate trace name DROP_SEGMENTS level ts#+1’; 

ts#是指要删除临时段的表空间的ts#


沪ICP备14014813号-2

沪公网安备 31010802001379号