Know more about RAC GES STATISTICS

GES 全称为Global Enqueue Services是RAC中重要的全局队列锁服务,V$GES_STATISTICS 动态性能视图汇聚了主要的GES STATISTICS 统计信息。为了更好地理解GES STATISTICS ,我们可以通过下表理解这些统计项的含义:


V$GES_STATISTICS Reference (10.2.0.1.0)


0 messages sent directly         


Incremented when any process successfully sends a message to a remote instance without being blocked and without flow control.


1 messages flow controlled                 


Incremented when any process could not send a message directly because there were not enough tickets available.


2 messages sent indirectly


Incremented when any process is asked to flow-control the message (i.e. a process tried to send a message indirectly, even if a ticket was available). This can also be incremented when previous message to the same target node had failed or a GCS/GES operation is being frozen.


3 messages received logical


When LMS receives a GCS/GES message from remote or local client, this statistic is incremented.


61 messages received actual


When LMS receives a message from a remote instance, this is incremented. A single actual message can contain multiple logical messages. Note, that when remote messages are queued, because they are flow controlled or they are indirectly / intentionally queued, the LMS process tries to send them in batch instead of flushing them individually.


4 flow control messages sent

5 flow control messages received


Messages flow controlled due to lack of ticket.


6 gcs msgs received

7 gcs msgs process time(ms)

8 ges msgs received

9 ges process time(ms)


When LMS receives a message, and if the message is related to either GCS (Global Cache Service) or GES (Global Enqueue Service) activity, it is incremented. After a GCS/GES message is processed, the process (typically LMD or LMS) updates the following statistics.


  • gcs msgs received
  • gcs msgs process time(ms)
  • ges msgs received
  • ges msgs process time(ms)


10 msgs causing lmd to send msgs 

11 lmd msg send time(ms)

65 msgs causing lms to send msgs 

66 lms msg send time(ms)


Incremented when the LMD/LMS processes a GCS/GES message and it causes LMD/LMS to send one or more messages. For example, if LMS receives a message, and as part of processing it sends four more messages, the statistic will be incremented by 1, not 4. In order to get the exact number of messages sent by LMS, the session statistic ‘gcs messages sent’ and ‘ges messages sent’ needs to be retrieved for the session running LMS (from V$SESSTAT).


12 gcs side channel msgs actual

13 gcs side channel msgs logical


‘side channel msgs logical’ indicates the number of blocks shipped from this node to other nodes. ‘side channel msgs actual’ indicates the actual number of messages sent to other nodes. When CR blocks or current blocks are sent to a remote node, the sender actually sends another reliable message to the requestor, because the CR block or current block being shipped could be lost. For example, a node sends 100 CR blocks to another node (logical number of messages). The sender node then may send a message saying ‘I’ve sent 100 blocks’ in a single message (actual number of messages). The init.ora parameter ‘_side_channel_batch_size’ defines the number of side channel messages to be sent in a single message.  With reliable IPC technology such as RSM and HyperFabric, we do not need side channel messages, and this value should be 0. With non-reliable IPC technology like UDP, these should be increased.


14 gcs pings refused


Incremented when the master node sends a BAST to a holder node, and the holder node is not able to service the BAST for some reason (typically because the block is not present or the ping queue is full).


15 gcs writes refused


Same as above, except that this is for Writes. In RAC if the blocks are globally dirty the writes are mediated by the GCS.


16 gcs error msgs


Certain race conditions in the GCS this statistic to be updated. It usually involves sending some extra messages to resolve the race through the use of error messages.


17 gcs out-of-order msgs


With direct sends, it is possible for two messages, which are sent from the same instance, to be received out-of-order at the master node. This statistic is updated whenever that happens.


18 gcs immediate (null) converts


Incremented when NULL lock can be granted immediately


19 gcs immediate cr (null) converts


Incremented when NULL lock for CR request can be granted immediately


20 gcs immediate (compatible) converts


Incremented when shared lock can be granted immediately


21 gcs immediate cr (compatible) converts


Incremented when shared lock for CR request can be granted immediately


22 gcs blocked converts


Incremented when the lock cannot be granted immediately. The lock is on the head of the convert queue.


23 gcs queued converts


Incremented when the lock cannot be granted immediately, and there is a conflicting lock in the convert queue ahead of this lock.


24 gcs blocked cr converts


Incremented when a CR request cannot be granted a lock because the lock is already being converted or the lock is in exclusive mode


25 gcs compatible basts


Number of BAST’s sent to holder node of a compatible lock.


26 gcs compatible cr basts (local)


CR request can be granted a lock, and BAST is sent to holder node. The lock is in local role.


60 gcs compatible cr basts (global)


This is incremented when the lock request is compatible but we can’t read from
disk because the block is globally dirty.


27 gcs cr basts to PIs


CR request is sent to an instance that has a PI buffer that satisfies this CR request.


28 dynamically allocated gcs resources

29 dynamically allocated gcs shadows


Number of gcs resources / shadows dynamically allocated after the startup of instance. We should not see these increasing at all.  _gcs_resources and _gcs_shadows could be used to change the default number of these resources to avoid dynamic allocation, but we should treat it as a bug (the default should be enough or it could be memory leak.).


30 gcs recovery claim msgs


Number of recovery claim messages processed by this instance.


31 gcs indirect ast


AST is sent to LMS instead of foreground process.


32 gcs dbwr write request msgs

33 gcs dbwr flush pi msgs

34 gcs lms write request msgs

35 gcs lms flush pi msgs

36 gcs write notification msgs


Messages related to flushing dirty XCUR / PI buffers. To flush PI buffers, request master node to write the most recent copy of the block in the global cache, which is ‘write request msgs’. Once the most recent copy of the block in the global cache is written to disk, PI buffers in the global cache can be purged, which is ‘flush pi msgs’. Once the most recent copy is written to disk, ‘write notification’ message is sent to the master node.


37 gcs retry convert request


Convert request had to be retried due to some race conditions.


38 gcs regular cr


CR for data blocks


39 gcs undo cr


CR for undo blocks


40 gcs assume no cvt


Assume was processed when the convert q is empty.


41 gcs assume cvt


Assume was processed when the convert q is non-empty.


42 broadcast msgs on commit(actual)


MCPD=0, number of messages sent to update the SCN.


43 broadcast msgs on commit(logical)


Same as 42, but logical (because the update may have been piggybacked).


44 broadcast msgs on commit(wasted)


Update SCN mesage is sent, but it is potentially a waste because receiver may have already updated the SCN.


45 acks for commit broadcast(actual)

46 acks for commit broadcast(logical)


Same as 42, 43 except that it applies to the receiving instance.


47 false posts waiting for scn acks


We posted LGWR because we thought MCPD broadcast completed, but it didn’t.


48 gcs forward cr to pinged instance


CR request is forwarded to the instance that is currently converting the GCS resource


49 gcs cr serve without current lock


CR block is served by the instance that does not have the current lock.


50 msgs sent queued

51 msgs sent queue time (ms)


Number of logical messages sent through send queue and their queuing time. Queuing time for queued messages: ‘msgs sent queue time (ms)’ / ‘msgs sent queued’  à Average message queuing time for flow controlled or indirectly sent messages. Note: this is calculated at ‘kjct’ layer (GCS/GES communication layer).


52 msgs sent queued on ksxp

53 msgs sent queue time on ksxp (ms)


Number of messages queued, and queuing time on ksxp layer. This includes all types of GCS/GES messages sent by any Oracle processes (foreground and background processes). Note: ‘msgs sent queued’ is a statistic from the kjct layer where we know if the messages are directly sent or indirectly sent.


54 msgs received queue time (ms)

55 msgs received queued


Elapsed time that a message is actually received until it is processed. Number of messages received  (logical). The ratio ‘msgs received queue time (ms)’ / ‘msgs received queued’ gives us the average queuing time between message arrival and start processing.


56 implicit batch messages sent

57 implicit batch messages received


Number of messages sent/received that are batched implicitly. Note: messages that are queued because of flow control or because of indirect messages, can be batched.


58 gcs refuse xid


Number of lock request received but refused to process by this instance, because index split is in progress (new in Oracle9i Release 2)


59 gcs ast xid


Number of lock request canceled because of index split


62 process batch messages sent

63 process batch messages received


Number of messages sent/received in batch.  When LMS receives multiple remote messages at a time, it processes all of them first, and then sends messages in batch as a result, instead of sending the result for each request individually.


64 messages sent pbatched


This is the number of messages being sent through process batching. This is the logical number whereas “process batch messages sent” is the actual number of messages sent out. Process batching in 10g is used for multi-block read, newing, receiver direct send (LMD0, LMS*, LMON) and fusion write (DBW*).


67 global posts requested


AQ requested that a global post be delivered to another instance


68 global posts dropped


Post was dropped because there was no buffer space.


69 global posts queued


A post was queued to be sent to another instance


70 global posts sent


A post was actually sent to another instance


71 global posts queue time


Time difference between enqueuing and sending the post.


72 messages sent not implicit batched


This is the number of indirect sent messages not get any batching done from the send proxies due to various reason. For example, the message is big enough or is defined as non-batch type.


73 messages queue sent actual


Actual number of messages sent indirectly by send proxies.


74 messages queue sent logical


Logical number of messages sent indirectly by send proxies including the number of embedded message batched either through process batching or batching done in send proxies.


实际V$GES_STATISTICS的信息来源于X$KJISFT内部视图
Know GCS AND GES structure size in shared pool

RAC环境中共享池很大一部分被gcs和ges资源所占用,一般来说这些资源对象都是永久的(perm)的,所以我们无法期待LRU或flush shared_pool操作能够清理这些资源。

在使用大缓存(large buffer cache)的RAC实例环境中,查询v$sgastat内存动态性能视图时总是能发现’gcs resources’、’gcs shadows’、’ ges resource’、’ges enqueues ‘这些组件占用了共享池中的大量内存,为了避免shared pool出现著名的ORA-04031错误,Oracle推荐在RAC环境中设置较大的shared_pool_size初始化参数,此外显示地设置较大的GCS和GES资源结构的初始化分配数(INITIAL_ALLOCATION)也有利于避免ORA-4031。

这些控制GES和GCS资源结构初始化分配数量的参数主要包括:

  • _gcs_resources  number of gcs resources to be allocated GCS Resources Number of GCS resource structures determined by
    _gcs_resources parameter
    Stored in segmented array
    Externalized in X$KJBR
    Number of free GCS resource structures in X$KJBRFX
  • _gcs_shadow_locks number of pcm shadow locks to be allocated GCS Enqueues (Shadows/Clients) Number of GCS enqueue structures determined by  _gcs_shadow_locks parameter Stored in segmented array
    Externalized in X$KJBL
    Number of free GCS enqueue structures in X$KJBLFX
  • _lm_ress number of resources configured for cluster database LM_RESS controls the number of resources that can be locked by each lock manager instance. These resources include lock resources allocated for DML, DDL (data dictionary locks), data dictionary, and library cache locks plus the file and log management locks. Stored in heap
    Externalized in X$KJIRFT
  • _lm_locks number of enqueues configured for cluster database Stored in segmented array
    Externalized in X$KJILKFT

为了更好地在RAC环境中设置shared_pool_size共享池的大小(手动设置该参数并不会disable AMM or ASMM),我们很有必要评估大量初始化分配的全局资源本身将占用shared pool多大的空间。

我们可以通过v$resource_limit视图了解这些GES、GCS全局资源的分配情况:

SQL> select * from v$version;

BANNER
--------------------------------------------------------------------------------
Oracle Database 11g Enterprise Edition Release 11.2.0.2.0 - 64bit Production
PL/SQL Release 11.2.0.2.0 - Production
CORE    11.2.0.2.0      Production
TNS for Linux: Version 11.2.0.2.0 - Production
NLSRTL Version 11.2.0.2.0 - Production

SQL> select * from global_name;

GLOBAL_NAME
--------------------------------------------------------------------------------
www.askmac.cn


SQL> select * from v$resource_limit where resource_name in ('gcs_resources', 'gcs_shadows','ges_ress','ges_locks'); 

RESOURCE_NAME                  CURRENT_UTILIZATION MAX_UTILIZATION INITIAL_ALLOCATION        LIMIT_VALUE
------------------------------ ------------------- --------------- ------------------------- ------------------
ges_ress                                      7223            7486    1000000                 UNLIMITED
ges_locks                                     4944            5027    1000000                 UNLIMITED
gcs_resources                                 4021            4021     114466                    114466
gcs_shadows                                   3925            3925     114466                    114466

可以通过v$sgastat视图了解这些全局资源占用了多少空间:

select *
  from v$sgastat
 where name in
       ('ges resource ', 'ges enqueues', 'gcs resources', 'gcs shadows');

POOL         NAME                            BYTES
------------ -------------------------- ----------
shared pool  gcs resources                16483232
shared pool  gcs shadows                  11904560
shared pool  ges enqueues                 47809680
shared pool  ges resource                288405768

单个gcs_resources结构大约占用120 bytes
单个gcs_shadows 结构大约占用72 bytes
单个ges_resource 结构大约占用288 bytes

我们可以使用一下初步估算GES、GCS资源结构将至少占用多大的共享池资源:

‘gcs_resources’ = initial_allocation * 120 bytes = “_gcs_resources parameter” * 120 bytes
‘gcs_shadows’ = initial_allocation * 72 bytes = “_gcs_shadow_locks parameter” * 72 bytes
‘ges_resource’= initial_allocation * 288 bytes = “_lm_ress parameter ” * 288 bytes

注意这里计算出的仅仅是理论的最小值,实际值因为内存分配的机制所以必然会远大于计算值

如上例中 gcs resources = 114466 * 120 =13735920 << 实际值的16483232
gcs_shadows = 114466 * 72 = 8241552 << 实际值的11904560
ges_resource = 1000000 * 288 = 288000000 < 实际的288405768

一般来说我们将计算值 * 160% 后可以得出一个较为客观的估算值。

注意以上公式只是为我们在RAC环境中调优共享池的大小提供参考的依据。当我们观察v$resource_limit视图并认为需要提高GES、GSC资源的初始化分配数目时,可以参照上述方式估算出必要的shared_pool_size或sga_target大小。

Oracle等待事件KJC:Wait for msg sends to complete

KJC: Wait for msg sends to complete是一种只会发生在RAC环境中的等待事件,目前对于该等待事件已知的信息不多。
KJ意为Kernel Lock Management Layer,Messaging Enhancements (KJC)。
猜测该等待事件为global enqueue message的网络传输等待,前台进程和后台进程如LMS、LMD均可能发生该等待事件。


select name,parameter1,parameter2,parameter3,wait_class from v$event_name where name like '%KJC%';

NAME                                                             PARAMETER1
---------------------------------------------------------------- ----------------------------------------------------------------
PARAMETER2                                                       PARAMETER3
---------------------------------------------------------------- ----------------------------------------------------------------
WAIT_CLASS
----------------------------------------------------------------
KJC: Wait for msg sends to complete                              msg
dest|rcvr                                                        mtype
Other

SQL> select * from gV$system_Event where event like '%KJC%';

   INST_ID EVENT                                                            TOTAL_WAITS
---------- ---------------------------------------------------------------- -----------
TOTAL_TIMEOUTS TIME_WAITED AVERAGE_WAIT TIME_WAITED_MICRO TOTAL_WAITS_FG TOTAL_TIMEOUTS_FG
-------------- ----------- ------------ ----------------- -------------- -----------------
TIME_WAITED_FG AVERAGE_WAIT_FG TIME_WAITED_MICRO_FG   EVENT_ID WAIT_CLASS_ID WAIT_CLASS#
-------------- --------------- -------------------- ---------- ------------- -----------
WAIT_CLASS
----------------------------------------------------------------
         2 KJC: Wait for msg sends to complete                                      415
             0           1            0              7638            163                 0
             0               0                 2494 4079369678    1893977003           0
Other

         1 KJC: Wait for msg sends to complete                                       93
             0           0            0              2094             37                 0
             0               0                  615 4079369678    1893977003           0
Other

注意到该等待事件的类别是other而非concurrency,若发生该等待事件我们应当关心的是网络性能
netstat -s or ifconfig?

以下为具体的等待发生场景:

PARSING IN CURSOR #140438030304224 len=169 dep=2 uid=0 oct=3 lid=0
tim=1310310630713104 hv=2411583655 ad='b5a49898' sqlid='637txtu7vvq57'
select service_name, service_name_hash,wait_class_id, wait_class#,  wait_class,total_waits, time_waited  from
gv$service_wait_class where inst_id = USERENV('Instance')

END OF STMT
PARSE #140438030304224:c=6999,e=7685,p=0,cr=5,cu=0,mis=1,r=0,dep=2,og=4,plh=809657567,tim=1310310630713101
CLOSE #140438030304224:c=0,e=20,dep=2,type=0,tim=1310310630713388
WAIT #140438029567384: nam='row cache lock' ela= 530 cache id=8 mode=0 request=3 obj#=6623 tim=1310310630716555
EXEC #140438032451672:c=0,e=61,p=0,cr=0,cu=0,mis=0,r=0,dep=2,og=4,plh=2853959010,tim=1310310630716708
FETCH #140438032451672:c=0,e=49,p=0,cr=4,cu=0,mis=0,r=1,dep=2,og=4,plh=2853959010,tim=1310310630716809
CLOSE #140438032451672:c=0,e=10,dep=2,type=3,tim=1310310630716877

WAIT #140438029567384: nam='KJC: Wait for msg sends to complete' ela= 18
msg=3235372280 dest|rcvr=65536 mtype=12 obj#=6623 tim=1310310630719146

EXEC #140438032420328:c=0,e=190,p=0,cr=1,cu=5,mis=0,r=1,dep=1,og=4,plh=0,tim=1310310630781989

WAIT #140438032420328: nam='KJC: Wait for msg sends to complete' ela= 55
msg=3235374760 dest|rcvr=65537 mtype=32 obj#=74418 tim=1310310630782830

这里的msg猜测可能是递增的message id
mytpe为该msg的类型
obj#为对象号

KJC: Wait for msg sends to complete可能的相关stack call:

LMS's stack:
ksedms ksdxfdmp ksdxcb sspuser sigacthandler libc_poll
kslwait ksxprcv kjctr_rksxp kjctsrw kjccwcrm kjccqmg
kjbmsclose kjbclose kclpdc kclpdcl kclpbi kjmsm
ksbrdp opirip opidrv sou2o main start 

 LMS4 was waiting for  "KJC: Wait for msg sends to complete"

  'KJC: Wait for msg sends to complete', at one of the stack trace
  below

  o kjccqmg => kjctcwcrm
  o kjccsmg => kjctcwcrm

o  an Oracle process is spinning in kjctcwcrm() on 9.0, 9.2 or 10.1

o  an Oracle process got ORA-600[kjccgmb:1] on 9.0, 9.2 or 10.1

o Got ORA-7445[] at an unknown function called from kjbmmsg2res()
o A LMS process hung in kjctcwcrm() on shutdown

LMS may hang waiting for 'kjc: wait for msg sends to complete'
during shutdown of an instance with another session
reporting ORA-600 [kjccgmb:1]

IAGNOSTIC ANALYSIS:
--------------------
Let the customer tracing the lmon, lmd when doing the shutdown immediate,
find out:
    In sur11_lmon_5948.trc
    WAIT #0: nam='ges LMD to shutdown' ela= 496057 p1=0 p2=0 p3=0
    WAIT #0: nam='KJC: Wait for msg sends to complete' ela= 49213 p1=0 p2=0
p3=0
    WAIT #0: nam='KJC: Wait for msg sends to complete' ela= 49811 p1=0 p2=0
p3=0
    WAIT #0: nam='KJC: Wait for msg sends to complete' ela= 49772 p1=0 p2=0
p3=0
    WAIT #0: nam='KJC: Wait for msg sends to complete' ela= 49813 p1=0 p2=0
p3=0
    WAIT #0: nam='KJC: Wait for msg sends to complete' ela= 49779 p1=0 p2=0
p3=0
    WAIT #0: nam='KJC: Wait for msg sends to complete' ela= 49787 p1=0 p2=0
p3=0
    WAIT #0: nam='KJC: Wait for msg sends to complete' ela= 49779 p1=0 p2=0 

	LMS4's stack:
ksedms ksdxfdmp ksdxcb sspuser sigacthandler libc_poll
kslwait ksxprcv kjctr_rksxp kjctsrw kjccwcrm kjccqmg
kjbmsclose kjbclose kclpdc kclpdcl kclpbi kjmsm
ksbrdp opirip opidrv sou2o main start 

LMS4 was encountered ORA-4031 during shutting down,

#0  0x0000000004f5bdbe in kjccqmg ()
#1  0x0000000005172378 in kjbmflushsc ()
#2  0x0000000005175351 in kjbmfto ()
#3  0x0000000004ff425f in kjmsm ()
#4  0x00000000022677a7 in ksbrdp ()
#5  0x000000000248c8a3 in opirip ()
#6  0x000000000171eefd in opidrv ()
#7  0x0000000001d95f5f in sou2o ()
#8  0x0000000000a079ba in opimai_real ()
#9  0x0000000001d9b408 in ssthrdmain ()
#10 0x0000000000a078a1 in main ()

(gdb) bt
#0  0x00000000053907aa in kclpbi ()
#1  0x0000000004ff46dc in kjmsm ()
#2  0x00000000022677a7 in ksbrdp ()
#3  0x000000000248c8a3 in opirip ()
#4  0x000000000171eefd in opidrv ()
#5  0x0000000001d95f5f in sou2o ()
#6  0x0000000000a079ba in opimai_real ()
#7  0x0000000001d9b408 in ssthrdmain ()
#8  0x0000000000a078a1 in main ()

(gdb) bt
#0  0x0000000004f5bdbe in kjccqmg ()
#1  0x00000000051a232a in kjbmswrite ()
#2  0x00000000051014f1 in kjbrswrite ()
#3  0x00000000050fec8d in kjbrwreq ()
#4  0x0000000005189fcc in kjbmpwrite ()
#5  0x0000000004fe98fe in kjmxmpm ()
#6  0x0000000004feceee in kjmpmsgi ()
#7  0x0000000004ff2d8e in kjmsm ()
#8  0x00000000022677a7 in ksbrdp ()
#9  0x000000000248c8a3 in opirip ()
#10 0x000000000171eefd in opidrv ()
#11 0x0000000001d95f5f in sou2o ()
#12 0x0000000000a079ba in opimai_real ()
#13 0x0000000001d9b408 in ssthrdmain ()
#14 0x0000000000a078a1 in main ()

以下列出了与该’KJC: Wait for msg sends to complete’相关的Bug信息

Bug Affected Version Description
Bug 5075434 Small performance overhead in RAC (waits for “KJC: Wait for msg sends to complete”) 10.2.0.2 RAC session can suffer a small performance overhead due to waiting for a timeout on “KJC: Wait for msg sends to complete”.
Bug 11687519: PZ99 PROCESS SPIN WITH “KJC: WAIT FOR MSG SENDS TO COMPLETE” 10.2.0.3 Abstract: PZ99 PROCESS SPIN WITH “KJC: WAIT FOR MSG SENDS TO COMPLETE”
Bug 4672266: LMS WAITING FOR ‘KJC: WAIT FOR MSG SENDS TO COMPLETE’ WHILE SHUTDOWN 9.2.0.4 Abstract: LMS WAITING FOR ‘KJC: WAIT FOR MSG SENDS TO COMPLETE’ WHILE SHUTDOWN LMS2 has been waiting for the event ‘KJC: Wait for msg sends to complete’
while SHUTDOWN IMMEDIATE.
My customer decided to issue SHUTDOWN ABORT to stop the instance in one hour.
Bug 4672266 LMS hang waiting for ‘kjc: wait for msg sends to complete’ during shutdown 9.2.0.4 9.2.0.7 10.1.0.5 10.2.0.2 LMS may hang waiting for ‘kjc: wait for msg sends to complete’ during shutdown of an instance with another session reporting ORA-600 [kjccgmb:1]
Bug 2447621 – Unneccessary waits for “KJC: WAIT FOR MSG SEND COMPLETION” <9.2 Unneccessary waits for “KJC: Wait for message completion” can occur in a RAC environment.
Bug 5347566: SHUTDOWN IMMEDIATE VERY SLOW WITH ‘KJC: WAIT FOR MSG SENDS TO COMPLETE’ 9.2.0.7 Exactly similar as Bug 5289823 and Bug 4672266 LMS hang waiting for ‘kjc: wait for msg sends to complete’ during shutdown
Bug 5084699: RACGIMON WAITING FOR ‘KJC: WAIT FOR MSG SENDS TO COMPLETE’ 10.2.0.1 racgimon on one of the 4 nodes cluster has been exhibiting process spin.
It appears to wait for 15 minutes every 20 minutes on “KJC: Wait for msg
sends to complete” in the following PL/SQL execution:
‘begin dbms_lock.allocate_unique(:a1, :a2); end;’
Bug 3561040: SHUTDOWN HANG DUE TO LMS PROCESS WAITING FOR KJC: WAIT FOR MSG SENDS TO COMPLETE 9.2.0.4 LMS process is waiting for  “KJC: Wait for msg sends to complete” while shutdown and shutdown does not complete.

了解你所不知道的SMON功能(六):Instance Recovery

SMON的作用还包括RAC环境中的Instance Recovery,注意虽然Instance Recovery可以翻做实例恢复,但实际上和我们口头所说的实例恢复是不同的。我们口头语言所说的实例恢复很大程度上是指Crash Recovery崩溃恢复,Instance Recovery与Crash Recovery是存在区别的:针对单实例(single instance)或者RAC中所有节点全部崩溃后的恢复,我们称之为Crash Recovery。而对于RAC中的某一个节点失败,存活节点(surviving instance)试图对失败节点线程上redo做应用的情况,我们称之为Instance Recovery。对于Crash Recovery更多的内容可见<还原真实的cache recovery>一文。

现象

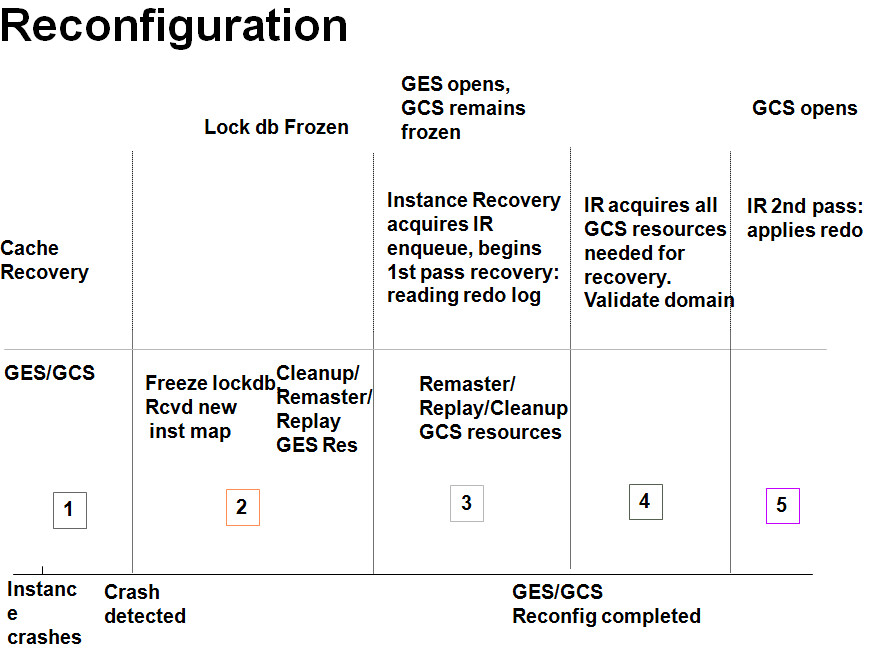
Instance Recovery期间分别存在cache recovery和ges/gcs remaster2个recovery stage,注意这2个舞台的恢复是同时进行的。cache recovery的主角是存活节点上的SMON进程,SMON负责分发redo给slave进程。而实施ges/gcs remaster的是RAC专有进程LMON。

整个Reconfiuration的过程如下图:
rac_instance_recovery_reconfiguration
 
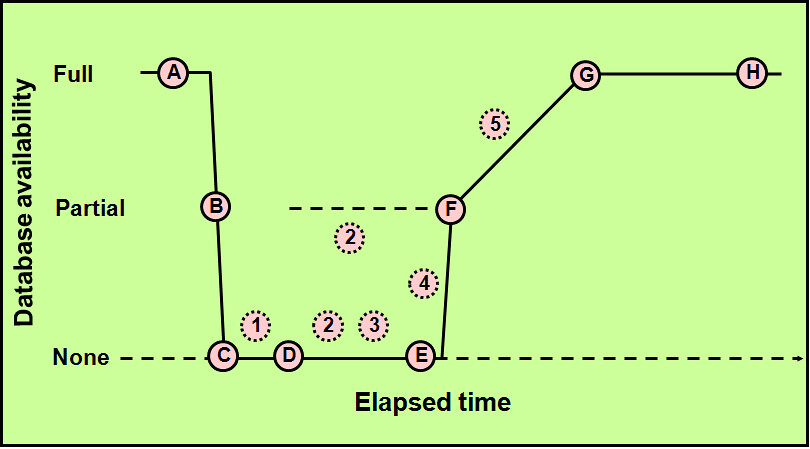
注意以上Crash Detected时数据库进入部分可用(Partial Availability)状态,从Freeze Lockdb开始None Availability,到IR applies redo即前滚时转换为Partial Availability,待前滚完成后会实施回滚,但是此时数据库已经进入完全可用(Full Availability)状态了,如下图:
 
oracledatabase12g_instance_recovery

The graphic illustrates the degree of database availability during each step of Oracle instance recovery: 

A.         Real Application Clusters is running on multiple nodes.

B.         Node failure is detected.

C.         The enqueue part of the GRD is reconfigured; resource management is redistributed to the surviving nodes. This operation occurs relatively quickly.

D.        The cache part of the GRD is reconfigured and SMON reads the redo log of the failed instance to identify the database blocks that it needs to recover.

E.         SMON issues the GRD requests to obtain all the database blocks it needs for recovery. After the requests are complete, all other blocks are accessible.

F.         The Oracle server performs roll forward recovery. Redo logs of the failed threads are applied to the database, and blocks are available right after their recovery is completed.

G.        The Oracle server performs rollback recovery. Undo blocks are applied to the database for all uncommitted transactions.

H.        Instance recovery is complete and all data is accessible.

Note: The dashed line represents the blocks identified in step 2 in the previous slide. Also, the dotted steps represent the ones identified in the previous slide.

我们来实际观察一下Instance Recovery的过程:

INST 1:

SQL> select * from v$version;

BANNER
--------------------------------------------------------------------------------
Oracle Database 11g Enterprise Edition Release 11.2.0.2.0 - 64bit Production
PL/SQL Release 11.2.0.2.0 - Production
CORE    11.2.0.2.0      Production
TNS for Linux: Version 11.2.0.2.0 - Production
NLSRTL Version 11.2.0.2.0 - Production

SQL> select * from global_name;

GLOBAL_NAME
--------------------------------------------------------------------------------
www.askmac.cn

SQL> alter system set event='10426 trace name context forever,level 12' scope=spfile;  -- 10426 event Reconfiguration trace event
System altered.

SQL> startup force;
ORACLE instance started.

INST 2:
SQL> shutdown abort
ORACLE instance shut down.

=============================================================
========================alert.log============================

Reconfiguration started (old inc 4, new inc 6)
List of instances:
 1 (myinst: 1)
 Global Resource Directory frozen
 * dead instance detected - domain 0 invalid = TRUE
 Communication channels reestablished
 Master broadcasted resource hash value bitmaps
 Non-local Process blocks cleaned out
 LMS 0: 0 GCS shadows cancelled, 0 closed, 0 Xw survived
 Set master node info
 Submitted all remote-enqueue requests
 Dwn-cvts replayed, VALBLKs dubious
 All grantable enqueues granted
 Post SMON to start 1st pass IR
Instance recovery: looking for dead threads
Beginning instance recovery of 1 threads
 parallel recovery started with 2 processes                 --2 recovery slave
 Submitted all GCS remote-cache requests
 Post SMON to start 1st pass IR
 Fix write in gcs resources
Reconfiguration complete
Started redo scan
Completed redo scan
 read 88 KB redo, 82 data blocks need recovery
Started redo application at
 Thread 2: logseq 374, block 2, scn 54624376
Recovery of Online Redo Log: Thread 2 Group 4 Seq 374 Reading mem 0
  Mem# 0: +DATA/prod/onlinelog/group_4.271.747100549
  Mem# 1: +DATA/prod/onlinelog/group_4.272.747100553
Completed redo application of 0.07MB
Completed instance recovery at
 Thread 2: logseq 374, block 178, scn 54646382
 73 data blocks read, 83 data blocks written, 88 redo k-bytes read
Thread 2 advanced to log sequence 375 (thread recovery)
Redo thread 2 internally disabled at seq 375 (SMON)
ARC3: Creating local archive destination LOG_ARCHIVE_DEST_1: '/s01/arch/2_374_747100216.dbf' (thread 2 sequence 374) (PROD1)
Setting Resource Manager plan SCHEDULER[0x310B]:DEFAULT_MAINTENANCE_PLAN via scheduler window
Setting Resource Manager plan DEFAULT_MAINTENANCE_PLAN via parameter
ARC3: Closing local archive destination LOG_ARCHIVE_DEST_1: '/s01/arch/2_374_747100216.dbf' (PROD1)
2011-06-27 22:19:29.280000 +08:00
Archived Log entry 792 added for thread 2 sequence 374 ID 0x9790ab2 dest 1:
ARC0: Creating local archive destination LOG_ARCHIVE_DEST_1: '/s01/arch/2_375_747100216.dbf' (thread 2 sequence 375) (PROD1)
2011-06-27 22:19:30.336000 +08:00
ARC0: Archiving disabled thread 2 sequence 375
ARC0: Closing local archive destination LOG_ARCHIVE_DEST_1: '/s01/arch/2_375_747100216.dbf' (PROD1)
Archived Log entry 793 added for thread 2 sequence 375 ID 0x9790ab2 dest 1:
minact-scn: Master considers inst:2 dead

==================================================================
===========================smon trace begin=======================

*** 2011-06-27 22:19:28.279
2011-06-27 22:19:28.279849 : Start recovery for domain=0, valid=0, flags=0x0
Successfully allocated 2 recovery slaves
Using 67 overflow buffers per recovery slave
Thread 2 checkpoint: logseq 374, block 2, scn 54624376
  cache-low rba: logseq 374, block 2
    on-disk rba: logseq 374, block 178, scn 54626382
  start recovery at logseq 374, block 2, scn 54624376
Instance recovery not required for thread 1

*** 2011-06-27 22:19:28.487
Started writing zeroblks thread 2 seq 374 blocks 178-185

*** 2011-06-27 22:19:28.487
Completed writing zeroblks thread 2 seq 374
==== Redo read statistics for thread 2 ====
Total physical reads (from disk and memory): 4096Kb
-- Redo read_disk statistics --
Read rate (ASYNC): 88Kb in 0.18s => 0.48 Mb/sec
Longest record: 8Kb, moves: 0/186 (0%)
Longest LWN: 33Kb, moves: 0/47 (0%), moved: 0Mb
Last redo scn: 0x0000.0341884d (54626381)
----------------------------------------------
----- Recovery Hash Table Statistics ---------
Hash table buckets = 262144
Longest hash chain = 1
Average hash chain = 82/82 = 1.0
Max compares per lookup = 1
Avg compares per lookup = 248/330 = 0.8
----------------------------------------------

*** 2011-06-27 22:19:28.489
KCRA: start recovery claims for 82 data blocks

*** 2011-06-27 22:19:28.526
KCRA: blocks processed = 82/82, claimed = 81, eliminated = 1
2011-06-27 22:19:28.526088 : Validate domain 0
 **************** BEGIN RECOVERY HA STATS  ****************

 I'm the recovery instance

 smon posted (1278500359646), recovery started 0.027 secs,(1278500359673)
 domain validated 0.242 secs (1278500359888)
 claims opened 70, claims converted 11, claims preread 0

 ****************  END RECOVERY HA STATS  *****************
2011-06-27 22:19:28.526668 : Validated domain 0, flags = 0x0

*** 2011-06-27 22:19:28.556
Recovery of Online Redo Log: Thread 2 Group 4 Seq 374 Reading mem 0

*** 2011-06-27 22:19:28.560
Completed redo application of 0.07MB

*** 2011-06-27 22:19:28.569
Completed recovery checkpoint
----- Recovery Hash Table Statistics ---------
Hash table buckets = 262144
Longest hash chain = 1
Average hash chain = 82/82 = 1.0
Max compares per lookup = 1
Avg compares per lookup = 330/330 = 1.0
----------------------------------------------
*** 2011-06-27 22:19:28.572 5401 krsg.c
Acquiring RECOVERY INFO PING latch from [krsg.c:5401] IX0
*** 2011-06-27 22:19:28.572 5401 krsg.c
Successfully acquired RECOVERY INFO PING latch IX+
*** 2011-06-27 22:19:28.572 5406 krsg.c
Freeing RECOVERY INFO PING latch from [krsg.c:5406] IX0
*** 2011-06-27 22:19:28.572 5406 krsg.c
Successfully freed RECOVERY INFO PING latch IX-
krss_sched_work: Prod archiver request from process SMON (function:0x2000)
krss_find_arc: Evaluating ARC3 to receive message (flags 0x0)
krss_find_arc: Evaluating ARC0 to receive message (flags 0x0)
krss_find_arc: Evaluating ARC1 to receive message (flags 0xc)
krss_find_arc: Evaluating ARC2 to receive message (flags 0x2)
krss_find_arc: Selecting ARC2 to receive REC PING message
*** 2011-06-27 22:19:28.572 3093 krsv.c
krsv_send_msg: Sending message to process ARC2
*** 2011-06-27 22:19:28.572 1819 krss.c
krss_send_arc: Sent message to ARC2 (message:0x2000)
Recovery sets nab of thread 2 seq 374 to 178 with 8 zeroblks
Retrieving log 4
pre-aal: xlno:4 flno:0 arf:0 arb:2 arh:2 art:4
Updating log 3 thread 2 sequence 375
Previous log 3 thread 2 sequence 0
Updating log 4 thread 2 sequence 374
Previous log 4 thread 2 sequence 374
post-aal: xlno:4 flno:0 arf:3 arb:2 arh:2 art:3
krss_sched_work: Prod archiver request from process SMON (function:0x1)
krss_find_arc: Evaluating ARC3 to receive message (flags 0x0)
krss_find_arc: Selecting ARC3 to receive message
*** 2011-06-27 22:19:28.589 3093 krsv.c
krsv_send_msg: Sending message to process ARC3
*** 2011-06-27 22:19:28.589 1819 krss.c
krss_send_arc: Sent message to ARC3 (message:0x1)
Retrieving log 2
Kicking thread 1 to switch logfile
Retrieving log 4
Retrieving log 3
krss_sched_work: Prod archiver request from process SMON (function:0x1)
krss_find_arc: Evaluating ARC0 to receive message (flags 0x0)
krss_find_arc: Selecting ARC0 to receive message
*** 2011-06-27 22:19:28.599 3093 krsv.c
krsv_send_msg: Sending message to process ARC0
*** 2011-06-27 22:19:28.599 1819 krss.c
krss_send_arc: Sent message to ARC0 (message:0x1)
*** 2011-06-27 22:19:28.599 838 krsv.c
krsv_dpga: Waiting for pending I/O to complete

*** 2011-06-27 22:19:29.304
krss_sched_work: Prod archiver request from process SMON (function:0x1)
krss_find_arc: Evaluating ARC1 to receive message (flags 0xc)
krss_find_arc: Selecting ARC1 to receive message
*** 2011-06-27 22:19:29.304 3093 krsv.c
krsv_send_msg: Sending message to process ARC1
*** 2011-06-27 22:19:29.304 1819 krss.c
krss_send_arc: Sent message to ARC1 (message:0x1)
SMON[INST-TXN-RECO]:about to recover undo segment 11 status:3 inst:2
SMON[INST-TXN-RECO]: mark undo segment 11 as available status:2 ret:0
SMON[INST-TXN-RECO]:about to recover undo segment 12 status:3 inst:2
SMON[INST-TXN-RECO]: mark undo segment 12 as available status:2 ret:0
SMON[INST-TXN-RECO]:about to recover undo segment 13 status:3 inst:2
SMON[INST-TXN-RECO]: mark undo segment 13 as available status:2 ret:0
SMON[INST-TXN-RECO]:about to recover undo segment 14 status:3 inst:2
SMON[INST-TXN-RECO]: mark undo segment 14 as available status:2 ret:0
SMON[INST-TXN-RECO]:about to recover undo segment 15 status:3 inst:2
SMON[INST-TXN-RECO]: mark undo segment 15 as available status:2 ret:0
SMON[INST-TXN-RECO]:about to recover undo segment 16 status:3 inst:2
SMON[INST-TXN-RECO]: mark undo segment 16 as available status:2 ret:0
SMON[INST-TXN-RECO]:about to recover undo segment 17 status:3 inst:2
SMON[INST-TXN-RECO]: mark undo segment 17 as available status:2 ret:0
SMON[INST-TXN-RECO]:about to recover undo segment 18 status:3 inst:2
SMON[INST-TXN-RECO]: mark undo segment 18 as available status:2 ret:0
SMON[INST-TXN-RECO]:about to recover undo segment 19 status:3 inst:2
SMON[INST-TXN-RECO]: mark undo segment 19 as available status:2 ret:0
SMON[INST-TXN-RECO]:about to recover undo segment 20 status:3 inst:2
SMON[INST-TXN-RECO]: mark undo segment 20 as available status:2 ret:0

*** 2011-06-27 22:19:43.299
* kju_tsn_aff_drm_pending TRACEUD: called with tsn x2, dissolve 0
* kju_tsn_aff_drm_pending TRACEUD: tsn_pkey = x2.1
* >> RM REQ QS ---:
 single window RM request queue is empty
 multi-window RM request queue is empty
* Global DRM state ---:
   There is no dynamic remastering
   RM lock state = 0
 pkey 2.1 undo 1 stat 0 masters[32768, 1->1] reminc 4 RM# 1
 flg x0 type x0 afftime x36e6e3a8
 nreplays by lms 0 = 0
* kju_tsn_aff_drm_pending TRACEUD: matching request not found on swin queue
* kju_tsn_aff_drm_pending TRACEUD: pp found, stat x0
* kju_tsn_aff_drm_pending TRACEUD: 2 return true

*** 2011-06-27 22:22:18.333
* kju_tsn_aff_drm_pending TRACEUD: called with tsn x2, dissolve 0
* kju_tsn_aff_drm_pending TRACEUD: tsn_pkey = x2.1

* >> RM REQ QS ---:
 single window RM request queue is empty
 multi-window RM request queue is empty
* Global DRM state ---:
   There is no dynamic remastering
   RM lock state = 0
 pkey 2.1 undo 1 stat 0 masters[32768, 1->1] reminc 4 RM# 1
 flg x0 type x0 afftime x36e6e3a8
 nreplays by lms 0 = 0
* kju_tsn_aff_drm_pending TRACEUD: matching request not found on swin queue
* kju_tsn_aff_drm_pending TRACEUD: pp found, stat x0
* kju_tsn_aff_drm_pending TRACEUD: 2 return true

*** 2011-06-27 22:24:53.365
* kju_tsn_aff_drm_pending TRACEUD: called with tsn x2, dissolve 0
* kju_tsn_aff_drm_pending TRACEUD: tsn_pkey = x2.1

* >> RM REQ QS ---:
 single window RM request queue is empty
 multi-window RM request queue is empty
* Global DRM state ---:
   There is no dynamic remastering
   RM lock state = 0
 pkey 2.1 undo 1 stat 0 masters[32768, 1->1] reminc 4 RM# 1
 flg x0 type x0 afftime x36e6e3a8
 nreplays by lms 0 = 0
* kju_tsn_aff_drm_pending TRACEUD: matching request not found on swin queue
* kju_tsn_aff_drm_pending TRACEUD: pp found, stat x0
* kju_tsn_aff_drm_pending TRACEUD: 2 return true

========================================================================
==============================lmon trace begin==========================

 *** 2011-06-27 22:19:27.748
kjxgmpoll reconfig instance map: 1

*** 2011-06-27 22:19:27.748
kjxgmrcfg: Reconfiguration started, type 1
CGS/IMR TIMEOUTS:
  CSS recovery timeout = 31 sec (Total CSS waittime = 65)
  IMR Reconfig timeout = 75 sec
  CGS rcfg timeout = 85 sec
kjxgmcs: Setting state to 4 0.

*** 2011-06-27 22:19:27.759
     Name Service frozen
kjxgmcs: Setting state to 4 1.
kjxgrdecidever: No old version members in the cluster
kjxgrssvote: reconfig bitmap chksum 0x2137452d cnt 1 master 1 ret 0
kjxgrpropmsg: SSMEMI: inst 1 - no disk vote
kjxgrpropmsg: SSVOTE: Master indicates no Disk Voting
2011-06-27 22:19:27.760783 : kjxgrDiskVote: nonblocking method is chosen
kjxggpoll: change poll time to 50 ms
2011-06-27 22:19:27.918847 : kjxgrDiskVote: Obtained RR update lock for sequence 5, RR seq 4
2011-06-27 22:19:28.023160 : kjxgrDiskVote: derive membership from CSS (no disk votes)
2011-06-27 22:19:28.023240 : proposed membership: 1

*** 2011-06-27 22:19:28.081
2011-06-27 22:19:28.081952 : kjxgrDiskVote: new membership is updated by inst 1, seq 6
2011-06-27 22:19:28.082073 : kjxgrDiskVote: bitmap: 1
CGS/IMR TIMEOUTS:
  CSS recovery timeout = 31 sec (Total CSS waittime = 65)
  IMR Reconfig timeout = 75 sec
  CGS rcfg timeout = 85 sec
kjxgmmeminfo: can not invalidate inst 2
kjxgmps: proposing substate 2
kjxgmcs: Setting state to 6 2.
kjfmSendAbortInstMsg: send an abort message to instance 2
 kjfmuin: inst bitmap 1
 kjfmmhi: received msg from inst 1 (inc 2)
     Performed the unique instance identification check
kjxgmps: proposing substate 3
kjxgmcs: Setting state to 6 3.
     Name Service recovery started
     Deleted all dead-instance name entries
kjxgmps: proposing substate 4
kjxgmcs: Setting state to 6 4.
     Multicasted all local name entries for publish
     Replayed all pending requests
kjxgmps: proposing substate 5
kjxgmcs: Setting state to 6 5.
     Name Service normal
     Name Service recovery done

*** 2011-06-27 22:19:28.191
kjxgmps: proposing substate 6
kjxgmcs: Setting state to 6 6.
kjxgmcs: total reconfig time 0.432 seconds (from 2895072218 to 2895072650)
kjxggpoll: change poll time to 600 ms
kjfmact: call ksimdic on instance (2)
2011-06-27 22:19:28.211846 :

********* kjfcrfg() called, BEGIN LMON RCFG *********
2011-06-27 22:19:28.211906 : * Begin lmon rcfg step KJGA_RCFG_BEGIN
* kjfcrfg: Resource broadcasting disabled
* kjfcrfg: kjfcqiora returned success
kjfcrfg: DRM window size = 4096->4096 (min lognb = 15)
2011-06-27 22:19:28.211954 :
Reconfiguration started (old inc 4, new inc 6)
TIMEOUTS:
  Local health check timeout: 70 sec
  Rcfg process freeze timeout: 70 sec
  Remote health check timeout: 140 sec
  Defer Queue timeout: 163 secs
  CGS rcfg timeout: 85 sec
  Synchronization timeout: 248 sec
  DLM rcfg timeout: 744 sec
List of instances:
 1 (myinst: 1)
Undo tsn affinity 1
OMF 0
2011-06-27 22:19:28.212394 : * Begin lmon rcfg step KJGA_RCFG_FREEZE

*** 2011-06-27 22:19:28.233
* published: inc 6, isnested 0, rora req 0,
  rora start 0, rora invalid 0, (roram 32767), isrcvinst 1,
  (rcvinst 1), isdbopen 1, drh 0, (myinst 1)
  thread 1, isdbmounted 1, sid hash x0
* kjfcrfg: published bigns successfully
* Force-published at step 3
2011-06-27 22:19:28.233575 :  Global Resource Directory frozen
* roram 32767, rcvinst 1
* kjfc_thread_qry: instance 1 flag 3 thread 1 sid 0
* kjfcrfg: queried bigns successfully
inst 1
* kjfcrfg: single_instance_kjga = TRUE

 asby init, 0/1/x2

 asby returns, 0/1/x2/false

* Domain maps before reconfiguration:
*   DOMAIN 0 (valid 1): 1 2
* End of domain mappings

 * dead instance detected - domain 0 invalid = TRUE

* Domain maps after recomputation:
*   DOMAIN 0 (valid 0): 1
* End of domain mappings
2011-06-27 22:19:28.235110 : * Begin lmon rcfg step KJGA_RCFG_COMM
2011-06-27 22:19:28.235242 : GSIPC:KSXPCB: msg 0xd8b84550 status 34, type 2, dest 2, rcvr 0
2011-06-27 22:19:28.235339 : GSIPC:KSXPCB: msg 0xd8b80180 status 34, type 2, dest 2, rcvr 1
 Active Sendback Threshold = 50 %
 Communication channels reestablished
2011-06-27 22:19:28.240076 : * Begin lmon rcfg step KJGA_RCFG_EXCHANGE
2011-06-27 22:19:28.240192 : * Begin lmon rcfg step KJGA_RCFG_ENQCLEANUP
 Master broadcasted resource hash value bitmaps
2011-06-27 22:19:28.251474 :
 Non-local Process blocks cleaned out
2011-06-27 22:19:28.251822 : * Begin lmon rcfg step KJGA_RCFG_CLEANUP
2011-06-27 22:19:28.265220 : * Begin lmon rcfg step KJGA_RCFG_TIMERQ
2011-06-27 22:19:28.265308 : * Begin lmon rcfg step KJGA_RCFG_DDQ
2011-06-27 22:19:28.265393 : * Begin lmon rcfg step KJGA_RCFG_SETMASTER
2011-06-27 22:19:28.271551 :
 Set master node info
2011-06-27 22:19:28.271931 : * Begin lmon rcfg step KJGA_RCFG_ENQREPLAY
2011-06-27 22:19:28.275490 :  Submitted all remote-enqueue requests
2011-06-27 22:19:28.275596 : * Begin lmon rcfg step KJGA_RCFG_ENQDUBIOUS
 Dwn-cvts replayed, VALBLKs dubious
2011-06-27 22:19:28.277223 : * Begin lmon rcfg step KJGA_RCFG_ENQGRANT
 All grantable enqueues granted
2011-06-27 22:19:28.277992 : * Begin lmon rcfg step KJGA_RCFG_PCMREPLAY
2011-06-27 22:19:28.279234 :
2011-06-27 22:19:28.279255 :  Post SMON to start 1st pass IR               --SMON posted by LMON
2011-06-27 22:19:28.307890 :  Submitted all GCS cache requests             --IR acquires all gcs resource needed for recovery
2011-06-27 22:19:28.308038 : * Begin lmon rcfg step KJGA_RCFG_FIXWRITES
 Post SMON to start 1st pass IR
 Fix write in gcs resources
2011-06-27 22:19:28.313508 : * Begin lmon rcfg step KJGA_RCFG_END
2011-06-27 22:19:28.313720 :
2011-06-27 22:19:28.313733 :
Reconfiguration complete

*   domain 0 valid?: 0
* kjfcrfg: ask RMS0 to do pnp work
 **************** BEGIN DLM RCFG HA STATS  ****************

 Total dlm rcfg time (inc 6): 0.100 secs (1278500359581, 1278500359681)
   Begin step .........: 0.001 secs (1278500359581, 1278500359582)
   Freeze step ........: 0.020 secs (1278500359582, 1278500359602)
   Remap step .........: 0.002 secs (1278500359602, 1278500359604)
   Comm step ..........: 0.005 secs (1278500359604, 1278500359609)
   Sync 1 step ........: 0.000 secs (0, 0)
   Exchange step ......: 0.000 secs (1278500359609, 1278500359609)
   Sync 2 step ........: 0.000 secs (0, 0)
   Enqueue cleanup step: 0.011 secs (1278500359609, 1278500359620)
   Sync pcm1 step .....: 0.000 secs (0, 0)
   Cleanup step .......: 0.013 secs (1278500359620, 1278500359633)
   Timerq step ........: 0.000 secs (1278500359633, 1278500359633)
   Ddq step ...........: 0.000 secs (1278500359633, 1278500359633)
   Set master step ....: 0.006 secs (1278500359633, 1278500359639)
   Sync 3 step ........: 0.000 secs (0, 0)
   Enqueue replay step : 0.004 secs (1278500359639, 1278500359643)
   Sync 4 step ........: 0.000 secs (0, 0)
   Enqueue dubious step: 0.001 secs (1278500359643, 1278500359644)
   Sync 5 step ........: 0.000 secs (0, 0)
   Enqueue grant step .: 0.001 secs (1278500359644, 1278500359645)
   Sync 6 step ........: 0.000 secs (0, 0)
   PCM replay step ....: 0.030 secs (1278500359645, 1278500359675)
   Sync 7 step ........: 0.000 secs (0, 0)
   Fixwrt replay step .: 0.003 secs (1278500359675, 1278500359678)
   Sync 8 step ........: 0.000 secs (0, 0)
   End step ...........: 0.001 secs (1278500359680, 1278500359681)
 Number of replayed enqueues sent / received .......: 0 / 0
 Number of replayed fusion locks sent / received ...: 0 / 0
 Number of enqueues mastered before / after rcfg ...: 2217 / 2941
 Number of fusion locks mastered before / after rcfg: 3120 / 5747

 ****************  END DLM RCFG HA STATS  *****************

*** 2011-06-27 22:19:36.589
kjxgfipccb: msg 0x0x7ff526139320, mbo 0x0x7ff526139310, type 19, ack 0, ref 0, stat 34

=====================================================================
============================lms trace begin==========================


*** 2011-06-27 22:38:54.663
2011-06-27 22:38:54.663764 :  0 GCS shadows cancelled, 0 closed, 0 Xw survived
2011-06-27 22:38:54.673539 :  5230 GCS resources traversed, 0 cancelled
2011-06-27 22:38:54.707671 :  9322 GCS shadows traversed, 0 replayed, 0 duplicates,
5183 not replayed, dissolve 0 timeout 0 RCFG(10) lms 0 finished replaying gcs resources
2011-06-27 22:38:54.709132 :  0 write requests issued in 384 GCS resources        --check past image
 0 PIs marked suspect, 0 flush PI msgs
2011-06-27 22:38:54.709520 :  0 write requests issued in 273 GCS resources
 1 PIs marked suspect, 0 flush PI msgs
2011-06-27 22:38:54.709842 :  0 write requests issued in 281 GCS resources
 0 PIs marked suspect, 0 flush PI msgs
2011-06-27 22:38:54.710159 :  0 write requests issued in 233 GCS resources
 0 PIs marked suspect, 0 flush PI msgs
2011-06-27 22:38:54.710531 :  0 write requests issued in 350 GCS resources
 lms 0 finished fixing gcs write protocol

Instance Recovery和普通的Crash Recovery最大的区别在于实例恢复过程中的GRD Frozen和对GES/GCS资源的Remaster,这部分工作主要由LMON进程完成,可以从以上trace中发现一些KJGA_RCFG_*形式的Reconfiguration步骤,它们的含义:

Reconfiguration Steps:

1.    KJGA_RCFG_BEGIN
LMON continuously polling for reconfiguration event. Once cgs reports a change in cluster membership,
LMON starts reconfiguration

2.    KJGA_RCFG_FREEZE
All processes acknowledges to the reconfiguration freeze before LMON continue 

3.    KJGA_RCFG_REMAP
Updates new instance map (kjfchsu), re-distributes resource mastership. Invalidate recovery domains
if reconfiguration is caused by instance death.

4.    KJGA_RCFG_COMM
Reinitialize communication channel

5.    KJGA_RCFG_EXCHANGE
Exchange of master information of gcs, ges and file affinity master

6.    KJGA_RCFG_ENQCLEANUP
Delete remote dead gcs/ges locks. Cancel converting gcs requests. 

7.    KJGA_RCFG_CLEANUP
Cleanup/remove ges resources

8.    KJGA_RCFG_TIMERQ
Restore relative timeout for enqueue locks on timeout queue

9.    KJGA_RCFG_DDQ
Clean out enqueue locks on deadlock queue

10.  KJGA_RCFG_SETMASTER
Update master info for each enqueue resources that need to be remastered.

11.  KJGA_RCFG_REPLAY
Replay enqueue locks

12.  KJGA_RCFG_ENQDUBIOUS
Invalidates ges resources without established value

13.  KJGA_RCFG_ENQGRANT
Grants all grantable ges lock requests

14.  KJGA_RCFG_REPLAY2
Enqueue reconfiguration complete. Post SMON to start instance recovery.  Starts replaying gcs resources.

15.  KJGA_RCFG_FIXWRITES2
Fix write state of gcs resources

16.  KJGA_RCFG_END
Unfreeze lock database

Instance Recovery相关的诊断事件
我们无法禁止Instance Recovery的发生,事实上一旦出现Instance Crash那么Instance Recovery就是必须的。
与Instance Recovery相关的诊断事件主要有10426和29717等:

    10426 – Reconfiguration trace event
    10425 – Enqueue operations
    10432 – Fusion activity
    10429 – IPC tracing

oerr ora 10425
10425, 00000, "enable global enqueue operations event trace"
// *Document: NO
// *Cause:
// *Action: Dump trace for global enqueue operations.

oerr ora 10426
10426, 00000, "enable ges/gcs reconfiguration event trace"
// *Document: NO
// *Cause:
// *Action: Dump trace for ges/gcs reconfiguration.

oerr ora 10430
10430, 00000, "enable ges/gcs dynamic remastering event trace"
// *Document: NO
// *Cause:
// *Action: Dump trace for ges/gcs dynamic remastering.

oerr ora 10401
10401, 00000, "turn on IPC (ksxp) debugging"
// *Cause:
// *Action: Enables debugging code for IPC service layer (ksxp)

oerr ora 10708
10708, 00000, "print out trace information from the RAC buffer cache"
// *Cause: N/A
// *Action: THIS IS NOT A USER ERROR NUMBER/MESSAGE.  THIS DOES NOT NEED TO BE
//          TRANSLATED OR DOCUMENTED. IT IS USED ONLY FOR DEBUGGING.

oerr ora 29717
29717, 00000, "enable global resource directory freeze/unfreeze event trace"
// *Document: NO
// *Cause:
// *Action: Dump trace for global resource directory freeze/unfreeze.

diag RAC INSTANCE SHUTDOWN LMON
LMON will dump more informations to trace during reconfig and freeze.

event="10426 trace name context forever, level 8"
event="29717 trace name context forever, level 5"
or
event="10426 trace name context forever, level 12"
event="10430 trace name context forever, level 12"
event="10401 trace name context forever, level 8"
event="10046 trace name context forever, level 8"
event="10708 trace name context forever, level 15"
event="29717 trace name context forever, level 5"

see 29717  grd frozen trace

alter system set event='29717 trace name context forever, level 5' scope=spfile;

=========================================================================
============================lmon trace begin=============================

********* kjfcrfg() called, BEGIN LMON RCFG *********
2011-06-27 23:13:16.693089 : * Begin lmon rcfg step KJGA_RCFG_BEGIN
* kjfcrfg: Resource broadcasting disabled
* kjfcrfg: kjfcqiora returned success
kjfcrfg: DRM window size = 4096->4096 (min lognb = 15)
2011-06-27 23:13:16.693219 :
Reconfiguration started (old inc 4, new inc 6)
TIMEOUTS:
  Local health check timeout: 70 sec
  Rcfg process freeze timeout: 70 sec
  Remote health check timeout: 140 sec
  Defer Queue timeout: 163 secs
  CGS rcfg timeout: 85 sec
  Synchronization timeout: 248 sec
  DLM rcfg timeout: 744 sec
List of instances:
 1 (myinst: 1)
Undo tsn affinity 1
OMF 0
[FDB][start]
2011-06-27 23:13:16.701320 : * Begin lmon rcfg step KJGA_RCFG_FREEZE
[FACK][18711 not frozen]          --fack means acknowledge in advance
[FACK][18713 not frozen]
[FACK][18719 not frozen]
[FACK][18721 not frozen]
[FACK][18723 not frozen]
[FACK][18729 not frozen]
[FACK][18739 not frozen]
[FACK][18743 not frozen]
[FACK][18745 not frozen]
[FACK][18747 not frozen]
[FACK][18749 not frozen]
[FACK][18751 not frozen]
[FACK][18753 not frozen]
[FACK][18755 not frozen]
[FACK][18757 not frozen]
[FACK][18759 not frozen]
[FACK][18763 not frozen]
[FACK][18765 not frozen]
[FACK][18767 not frozen]
[FACK][18769 not frozen]
[FACK][18771 not frozen]
[FACK][18775 not frozen]
[FACK][18777 not frozen]
[FACK][18816 not frozen]
[FACK][18812 not frozen]
[FACK][18818 not frozen]
[FACK][18820 not frozen]
[FACK][18824 not frozen]
[FACK][18826 not frozen]
[FACK][18830 not frozen]
[FACK][18835 not frozen]
[FACK][18842 not frozen]
[FACK][18860 not frozen]
[FACK][18865 not frozen]
[FACK][18881 not frozen]
[FACK][18883 not frozen]
[FACK][18909 not frozen]

*** 2011-06-27 23:13:16.724
* published: inc 6, isnested 0, rora req 0,
  rora start 0, rora invalid 0, (roram 32767), isrcvinst 0,
  (rcvinst 32767), isdbopen 1, drh 0, (myinst 1)
  thread 1, isdbmounted 1, sid hash x0
* kjfcrfg: published bigns successfully
* Force-published at step 3
2011-06-27 23:13:16.724764 :  Global Resource Directory frozen
* kjfc_qry_bigns: noone has the rcvinst established yet, set it to the highest open instance = 1
* roram 32767, rcvinst 1
* kjfc_thread_qry: instance 1 flag 3 thread 1 sid 0
* kjfcrfg: queried bigns successfully

=====================================================================
==========================lmd0 trace begin===========================

*** 2011-06-27 23:13:16.700
[FFCLI][frozen]
[FUFCLI][normal]

Identify ksusetxn DID:An Deadlock ID

我们在查看10704 event trace(Print out information about what enqueues are being obtained)或deadlock detected trace死锁检测跟踪日志时,总是会看到名为”DID”的名词,影响”DID”这个名词被正确理解的一个原因是你很难通过search engine正确找到相关的正确解释(被误解)。

那么DID到底是什么东西呢?我们来看一下trace中的DID:

=====================10704 enqueue trace========================

ksqgtl *** CU-913f5a28-00000000 mode=6 flags=0x10010 timeout=300 ***
ksqgtl: no transaction
ksqgtl: use existing ksusetxn DID
ksqgtl:
        ksqlkdid: 0002-001E-00000026

*** 2011-05-09 23:44:15.210
*** ksudidTrace: ksqgtl
        ksusesdi:   0002-001E-00000025
        ksusetxn:   0002-001E-00000026
ksqgtl: RETURNS 0

*** 2011-05-09 23:44:15.212
ksqrcl: CU,913f5a28,0
ksqrcl: returns 0

*** 2011-05-09 23:44:15.212
ksqgtl *** TM-00013abc-00000000 mode=6 flags=0x401 timeout=21474836 ***
ksqgtl: xcb=0x97227118, ktcdix=2147483647, topxcb=0x97227118
        ktcipt(topxcb)=0x0

*** 2011-05-09 23:44:15.212
ksucti: init txn DID from session DID
ksqgtl:
        ksqlkdid: 0002-001E-00000026

*** 2011-05-09 23:44:15.212
*** ksudidTrace: ksqgtl
        ktcmydid(): 0002-001E-00000026
        ksusesdi:   0002-001E-00000025
        ksusetxn:   0002-001E-00000026

===========================global enqueue deadlock detected==========================

Global Wait-For-Graph(WFG) at ddTS[0.1] :
BLOCKED 0xda9da740 5 wq 2 cvtops x1 TX 0x110001.0x8c(ext 0x5,0x0)[34000-0001-0000006E] inst 1
BLOCKER 0x99a2bf50 5 wq 1 cvtops x28 TX 0x110001.0x8c(ext 0x5,0x0)[1E000-0002-0000001D] inst 2
BLOCKED 0x99448ad8 5 wq 2 cvtops x1 TX 0x9000d.0x7b9(ext 0x2,0x0)[1E000-0002-0000001D] inst 2
BLOCKER 0xda983008 5 wq 1 cvtops x28 TX 0x9000d.0x7b9(ext 0x2,0x0)[34000-0001-0000006E] inst 1

DID即Deadlock id,在Oracle死锁检测时充当一个进程的identifier.可以看到lmd RAC后台进程的global enqueue deadlock detected日志中的DID与单实例死锁检测日志或10704事件跟踪日志中的DID在格式上存在区别,但他们的内容是一样的,我们以单实例中的DID为例:

002-001E-00000026

002:instance number,实例号

001E: 十进制的30,ORACLE PID,ORACLE进程号

0026:十进制的38,类似于v$session.serial#,ORACLE PID的一个串行值,复用ORACLE PID后会递增

global enqueue deadlock detected日志中的DID也是类似的,仅仅是把instance number和oracle pid的顺序颠倒了,同时pid要从高位读起。

Under the Hoods of Cache Fusion, GES, GRD and GCS

•If I have a 100MB database, I can have a 100 MB buffer cache and I never have to go to the disk, right?
•How does Cache Fusion know where to get the block from?
•I’m confused about Global Cache Service (GCS), Global Resource Directory (GRD) and Global Enqueue Service (GES)
•We will understand how all these actually work

[Read more…]

Know Oracle Lock Mode

Value   Name(s)                    Table method (TM lock)
    0   No lock                    n/a

    1   Null lock (NL)             Used during some parallel DML operations (e.g. update) by
                                   the pX slaves while the QC is holding an exclusive lock.

    2   Sub-share (SS)             Until 9.2.0.5/6 "select for update"
        Row-share (RS)             Since 9.2.0.1/2 used at opposite end of RI during DML
                                   Lock table in row share mode
                                   Lock table in share update mode

    3   Sub-exclusive(SX)          Update (also "select for update" from 9.2.0.5/6)
        Row-exclusive(RX)          Lock table in row exclusive mode
                                   Since 11.1 used at opposite end of RI during DML

    4   Share (S)                  Lock table in share mode
                                   Can appear during parallel DML with id2 = 1, in the PX slave sessions
                                   Common symptom of "foreign key locking" (missing index) problem

    5   share sub exclusive (SSX)  Lock table in share row exclusive mode
        share row exclusive (SRX)  Less common symptom of "foreign key locking" but likely to be more
                                   frequent if the FK constraint is defined with "on delete cascade."

    6   Exclusive (X)              Lock table in exclusive mode

Summary of Locks Obtained by DML Statements

SQL Statement Row Locks Table Lock Mode RS RX S SRX X
SELECTFROM table... none Y Y Y Y Y
INSERT INTO table Yes SX Y Y N N N
UPDATE table Yes SX Y* Y* N N N
MERGE INTO table Yes SX Y Y N N N
DELETE FROM table Yes SX Y* Y* N N N
SELECTFROM table FOR UPDATE OF Yes SX Y* Y* N N N
LOCK TABLE table IN
ROW SHARE MODE SS Y Y Y Y N
ROW EXCLUSIVE MODE SX Y Y N N N
SHARE MODE S Y N Y N N
SHARE ROW EXCLUSIVE MODE SSX Y N N N N
EXCLUSIVE MODE X N N N N N
* Yes, if no conflicting row locks are held by another transaction. Otherwise, waits occur.


mode 1: NL Null N
mode 2: SS RS Row-S Row Share(d) SubShare Intended Share (IS) L
mode 3: SX RX Row-X Row Exclusive SubExclusive Intended Exclusive (IX) R
mode 4: S Share S
mode 5: SSX SRX S/Row-X Share(d) Row Exclusive Share-SubExclusive C
mode 6: X Exclusive X


compatible ? SS,RS SX,RX S SSX,SRX X
SS,RS yes yes yes yes no
SX,RX yes yes no no no
S yes no yes no no
SSX, SRX yes no no no no
X no no no no no

GES (global enqueue resources) enqueues having different values for the lock mode:

#define KJUSERNL 0          /* no permissions */    (Null)
#define KJUSERCR 1          /* concurrent read */   (Row-S (SS))
#define KJUSERCW 2          /* concurrent write */  (Row-X (SX))
#define KJUSERPR 3          /* protected read */    (Share)
#define KJUSERPW 4          /* protected write */   (S/Row-X (SSX))
#define KJUSEREX 5          /* exclusive access */  (Exclusive)

Global Wait-For-Graph(WFG) at ddTS[0.db] :
BLOCKED 0xd876a630 5 wq 2 cvtops x1 TX 0x70015.0x81e(ext 0x2,0x0)[2B000-0001-0000057A] inst 1
BLOCKER 0xd8767a10 5 wq 1 cvtops x28 TX 0x70015.0x81e(ext 0x2,0x0)[2E000-0001-00000347] inst 1
BLOCKED 0xd876ab70 5 wq 2 cvtops x1 TX 0x40008.0x7d9(ext 0x2,0x0)[2E000-0001-00000347] inst 1
BLOCKER 0xd876a7f0 5 wq 1 cvtops x28 TX 0x40008.0x7d9(ext 0x2,0x0)[2B000-0001-0000057A] inst 1

5 means KJUSEREX ,cross instance "TX mode 6" locks

沪ICP备14014813号-2

沪公网安备 31010802001379号