ocfs certification with 11gr2 rac

We are planning to implement 11gR2 RAC on OCFS2 file system. We are going to have ocr files,voting disk files,database files and flash recovery area files on OCFS2 file system.
Generic Note
————————
ocfs2 is certified for oracle 11gr2 but oracle recommends using asm.
please see this for more information http://download.oracle.com/docs/cd/E11882_01/install.112/e10812/storage.htm#CWLIN262
3.1.3 Supported Storage Options
The following table shows the storage options supported for storing Oracle Clusterware and Oracle RAC files.

Note:

For information about OCFS2, refer to the following Web site:
http://oss.oracle.com/projects/ocfs2/
If you plan to install an Oracle RAC home on a shared OCFS2 location, then you must upgrade OCFS2 to at least version 1.4.1, which supports shared writable mmaps.

For OCFS2 certification status, and for other cluster file system support, refer to the Certify page on My Oracle Support.

Table 3-1 Supported Storage Options for Oracle Clusterware and Oracle RAC
Linux x86-64
11gR2 RAC
RAC for LinuxRAC Technologies Compatibility Matrix (RTCM) for Linux platforms.

http://www.oracle.com/technology/products/database/clustering/certify/tech_generic_linux_new.html

Note 183408.1 Raw Devices and Cluster Filesystems With Real Application Clusters
Note 238278.1 How to find the current OCFS or OCFS2 version for Linux
Note 811306.1 RAC Assurance Support Team: RAC Starter Kit and Best Practices (Linux)

西宁旅记:管中窥豹

6月11日5点天刚蒙蒙亮,极不自然地醒过来,因为要赶飞机的缘故又是一夜没睡好;从家中打车到浦东机场需用一个多小时,抵达时已经6点半了,我要搭乘7点50分的飞机,自上海出发到西安转机到青海西宁。这次是公司在开拓青海省期间的一次技术交流,对象是西宁市的一家政府下属单位。

早晨的浦东机场已经十分忙碌,考虑到是世博期间人流更胜往常;这里是大魔都一处永不停歇的驿站,在这里人流喷涌,为这个国家带来所有未知机遇。

一行无话,11点40分抵达西安,西安的机场还是挺大的,至少在西部诸省仍是佼佼者;我一直很向往这个古老城市:秦,两汉,唐;这个城市记录了中华最辉煌的年代,在我心目中这种气度不是帝都所能比的,不过这次是无缘游访了。

1点钟不到终于到达目的地,青海省西宁市这个边陲省会;从机场向外看去一望无际的土山让生长在上海没有出过远门的我有些惊讶,西宁机场不大,虽然离地震已经过去一段时间了但仍到处插着”青海长青,玉树不倒”的标语,西宁机场目下正在扩建,灾后重建需要一个现代化的机场。

落地后赶忙和负责西北地区的张,胡两位取得了联系,他们下榻在中心广场的如家,据说是此地的市中心,而自机场打的到市区则似乎是统一的一百元;西宁市的的士规格参差不齐,但车顶上大大的广告牌似乎要比上海的还要先进,部分的士甚至是私家的车子,起步费统一的6元;上车前最好问清楚是否能给发票,不然可能会很麻烦。

载我的那位的哥十分健谈,据他介绍青海自古是移民地区,目前是以汉族为主,而部分口音类似于南京周边的方言。青海亦是三江源头为长江,黄河,澜沧江的源头汇水区,比较好玩的景区有青海湖和贵德,土产有牦牛干,人参果,裸鲤,毛毯等。谈话中时间过得飞快,期间途遇到2个收费站,让我对外地的路费有了新的认识。进入城区后先上到高架,大致可以一览市区全貌,据司机师傅介绍目前西宁市区的房价是在6千左右,要想在此处安家却也不容易啊!

在城区里穿行片刻就抵达了旅馆,与本地的2位从未谋面的同事寒暄过后,自然是要先祭祭五脏的;他们带我去旅馆旁边一个样式古老的美食城就餐,西北向来以面食出名,古来就说西北的水偏碱做面食十分相宜,其名声远胜南方,此外就多是牛羊肉,大盘鸡之属了。牛羊肉做主食,南方人多半受不了,我点了一叠面,口味尚佳,比起上海六七元的阳春面这里要便宜得多了。

吃完饭匆匆赶赴客户单位,路上竟堵了许久,想不到此处下午1点多也会有rush hour。

来到客户单位已是2点多,从客户的张科长,朱工程师口中大致了解了系统规模,这里主用的一套Linux上的RAC系统共有3个节点,硬件是三台Dell的3950 Pc Server以及一台IBM DS4700存储,三个实例接受不同地区的业务,客户目前对这套RAC系统的性能不顶满意,希望此次技术交流能够提出初步的方案,另外他们对与主机上较高的内存使用率表示疑问。

我首先抓取了RDA以及AWR报告,托福于这些工具Oracle的诊断调优信息收集已经十分集成了。这个系统居然还采用了ASM,Linux上RAC系统大致可以采取以下几种存储管理方式:裸设备(最容易也最麻烦),NFS(生产环境无法用),ASM(Oracle 推荐),OCFS2(11g被抛弃了),其他GPFS(譬如RedHat GPFS,Veritas Cluster Filesystem);10g下最时髦的管理方式还属ASM,ASM技术新颖,但普遍认为10gASM还不够成熟,至少客户应用上经验不足,一旦出现问题,除了向Oracle GCS求助外很少能找到其他解决方法。而且这套ASM系统直接使用形如/dev/sd*的块设备作为disk,不同于裸设备,使用块设备将会引起操作系统对块的进一步缓存(OS CACHE),这套系统除了跑数据库外没有其他应用,总内存为24g而每个实例使用的SGA不足5g,绝大多数内存都用作了缓存块设备。

[oracle@qhds2 ~]$ free
total       used       free     shared    buffers     cached
Mem:      16408324   16276472    131852          0      44184   13969312
-/+ buffers/cache:    2262976      14145348
Swap:      2031608      90224    1941384

如上所示空闲物理内存131852即128M,OS cache为13G。Oracle使用的高速缓存(Buffer_Cache)要较OS的cache更为有效,而目前三个实例设置的Buffer_cache为2-3G不等,建议客户调大Buffer_Cache至5-10G,同时为杜绝操作系统因物理内存不足,瞬间换页造成宕机事件发生的可能性,建议客户将Linux内核参数vm.min_free_kbytes 设置为512000(即总是保留500M的空闲物理内存)。

数据库中三个实例,整体负载(Load)处于较低的水平。相对而言1号实例最高,16小时快照内1号实例上Average Active Session(平均活动会话数,为10g中数据库负载的重要指标)为(AAS=DB_TIME/Elapsed=2327/960)2.42;2号实例上AAS为592/960=0.61;3号上AAS为1405/960=1.463。
分析AWR 报告可以发现:

1号实例:

Event Waits Time(s) Avg Wait(ms) % Total Call Time Wait Class
enq: TM – contention 98,218 40,208 409 28.8 Application
gc cr multi block request 5,877,437 36,369 6 26.0 Cluster
CPU time 8,511 6.1
gc buffer busy 64,538 5,455 85 3.9 Cluster
db file parallel read 519,589 4,116 8 2.9 User I/O

2号实例:

Event Waits Time(s) Avg Wait(ms) % Total Call Time Wait Class
CPU time 7,962 22.4
gc cr multi block request 2,903,270 6,027 2 17.0 Cluster
db file scattered read 843,958 3,070 4 8.6 User I/O
db file parallel read 421,792 3,010 7 8.5 User I/O
PX Deq Credit: send blkd 248,625 1,755 7 4.9 Other

3号实例:

Event Waits Time(s) Avg Wait(ms) % Total Call Time Wait Class
CPU time 18,381 21.8
gc cr multi block request 6,534,528 18,204 3 21.6 Cluster
db file scattered read 1,562,020 5,575 4 6.6 User I/O
db file parallel read 563,113 4,281 8 5.1 User I/O
db file sequential read 709,698 2,502 4 3.0 User I/O

主要的几个等待是:

  • ENQ:TM- Contention
  • Gc cr multi block request
  • CPU-TIME

“Gc Multi Block request”为全局缓存多块请求事件,是一种集群类等待事件。当RAC中每个实例所涉及的数据严重交叉时该事件将成为数据库的主要性能瓶颈。在不能通过改善应用程序集群适应性或对表进行实例划分分区的情况下,建议客户将RAC中的多个实例划为主用和备用实例以获取更好的性能。举例来说可以将硬件性能较好的一号主机作为主用主机,而二三号主机作为备用主机平时不接受应用程序会话,在一号主机需要OFFLINE时做应急用。客户使用RAC系统的最主要目的是为了获取高可用性,而通过向客户解释RAC Global Cache大致的工作原理后,客户首肯了这个方案。

EnQ:TM-Contention即TM锁队列等待,一般是应用程序对表执行共享级以上的表锁时(包括:S,SSX,X锁)且锁定时间过长或表上有外键约束引起的,大多数OLTP类型应用中对整个表的S,SX,X锁是不必要的,只需要行级锁(ROW LEVEL LOCK)即可以满足需要。客户本身也在怀疑应用程序存在问题,但苦于没有有力证据,无法督促开发商修改程序,又因为目前这套应用数据量,业务量都较小,这种矛盾仍不尖锐,所以总是没有行之有效地整改。

讨论完这些已将界6点,匆匆和同事回旅馆吃了晚饭。趁着天还没彻底晚,打的找了当地一个专卖土特产的超市,因为不想回去是负重过高,随便买了几包牦牛干,人参果。这忙碌的一天也就算完了,回旅馆睡觉!

第二天早晨抓紧时间再赶到客户处,另看了一套系统,因为要赶下午2点的飞机,所以行色匆匆,客户平常是使用本地java客户端的EM和10g上web形式的EM监控数据库的,在机房中的笔记本上使用SYS用户可以成功登陆,但在科室里的台式机上登陆就报用户名/密码错误的信息,初步怀疑是设置了SQLNET.ORA的某些参数,由于时间无多,这个问题只能摆脱后续的工程师解决了,呵呵!

回程仍需到西安转机,不过由于机票订得晚,经济舱已经满座了,十分不巧地做了会头等舱,也算一种福利吧。

呵呵,西宁二十四小时,对这个城市管中窥豹了!

11g compression 新特性(1)

11g引入了大量compress相关的特性,其中之一便是dbms_compression包;GET_COMPRESSION_RATIO函数可以帮助我们了解压缩某个表后各种可能的影响。换而言之,这个函数可以让我们在具体实施表压缩技术或者测试前,对于压缩后的效果能有一个基本的印象。该包在11gr2中被首次引入,故而使用之前版本的包括11gr1都无缘得用。其次除OLTP压缩模式之外的柱形混合压缩只能在基于Exdata存储的表空间上实现。使用DBMS_COMPRESSION包获取的相关压缩信息是十分准确的,因为在评估过程中Oracle通过实际采样并建立模型表以尽可能还原逼真的数据。 我们可以通过trace来分析其评估过程中的具体操作,可以分成2步:

1. 建立原表的样本表,其采样值基于原表的大小:

SQL> create table samp_dss_nation tablespace SCRATCH as select * from dss_nation sample block (50);

Table created.

2. 基于采用表建立对应压缩类型的模型表:

SQL> create table model_dss_nation tablespace SCRATCH compress for query high as select * from samp_dss_nation;
create table model_dss_nation tablespace SCRATCH compress for query high as select * from samp_dss_nation
*
ERROR at line 1:
ORA-64307: hybrid columnar compression is only supported in tablespaces
residing on Exadata storage

可以看到在实际建立过程中Oracle将拒绝在非Exdata存储的表空间上建立该类柱形混合压缩(包括:COMP_FOR_QUERY_HIGH,COMP_FOR_QUERY_LOW,COMP_FOR_ARCHIVE_HIGH,CO
MP_FOR_ARCHIVE_LOW)。但DBMS_COMPRESSION在进行评估时可以绕过Oracle对于该类操作的LOCK.

要在没有Exdata存储设备的情况下使用dbms_compression包评测OLTP压缩模式外的柱状混合压缩模式时
(hybrid columnar compression is only supported in tablespaces residing on Exadata storage),首先需要打上patch 8896202:

[oracle@rh2 admin]$ /s01/dbhome_1/OPatch/opatch lsinventory
Invoking OPatch 11.1.0.6.6

Oracle Interim Patch Installer version 11.1.0.6.6
Copyright (c) 2009, Oracle Corporation.  All rights reserved.

Oracle Home       : /s01/dbhome_1
Central Inventory : /s01/oraInventory
from           : /etc/oraInst.loc
OPatch version    : 11.1.0.6.6
OUI version       : 11.2.0.1.0
OUI location      : /s01/dbhome_1/oui
Log file location : /s01/dbhome_1/cfgtoollogs/opatch/opatch2010-06-02_23-08-33PM.log

Patch history file: /s01/dbhome_1/cfgtoollogs/opatch/opatch_history.txt

Lsinventory Output file location : /s01/dbhome_1/cfgtoollogs/opatch/lsinv/lsinventory2010-06-02_23-08-33PM.txt

--------------------------------------------------------------------------------
Installed Top-level Products (1):

Oracle Database 11g                                                  11.2.0.1.0
There are 1 products installed in this Oracle Home.

Interim patches (1) :

Patch  8896202      : applied on Wed Jun 02 21:55:44 CST 2010
Unique Patch ID:  11909460
Created on 29 Oct 2009, 15:21:45 hrs US/Pacific
Bugs fixed:
8896202

该patch用以:ENABLE COMPRESSION ADVISOR TO ESTIMATE EXADATA HCC COMPRESSION RATIOS

接着我们还需要运行被修改后的DBMSCOMP包创建SQL,具体操作为:

SQL> @?/rdbms/admin/prvtcmpr.plb

Package created.

Grant succeeded.

Package body created.

No errors.

Package body created.

No errors.

Type body created.

No errors.
SQL> @?/rdbms/admin/dbmscomp.sql

Package created.

Synonym created.

Grant succeeded.

No errors.

DBMS_COMPRESSION包在对表压缩进行评估时,默认表最少数据为1000000行,可能在你的测试库中没有这么多数据,我们可以修改这个下限;

通过将COMP_RATIO_MINROWS常数修改为1后,就可以分析最小为1行的表了:

SQL>create or replace package sys.dbms_compression authid current_user is

  COMP_NOCOMPRESS       CONSTANT NUMBER := 1;
  COMP_FOR_OLTP         CONSTANT NUMBER := 2;
  COMP_FOR_QUERY_HIGH   CONSTANT NUMBER := 4;
  COMP_FOR_QUERY_LOW    CONSTANT NUMBER := 8;
  COMP_FOR_ARCHIVE_HIGH CONSTANT NUMBER := 16;
  COMP_FOR_ARCHIVE_LOW  CONSTANT NUMBER := 32;

  COMP_RATIO_MINROWS CONSTANT NUMBER := 10;
  COMP_RATIO_ALLROWS CONSTANT NUMBER := -1;

  PROCEDURE get_compression_ratio(scratchtbsname IN varchar2,
                                  ownname        IN varchar2,
                                  tabname        IN varchar2,
                                  partname       IN varchar2,
                                  comptype       IN number,
                                  blkcnt_cmp     OUT PLS_INTEGER,
                                  blkcnt_uncmp   OUT PLS_INTEGER,
                                  row_cmp        OUT PLS_INTEGER,
                                  row_uncmp      OUT PLS_INTEGER,
                                  cmp_ratio      OUT NUMBER,
                                  comptype_str   OUT varchar2,
                                  subset_numrows IN number DEFAULT COMP_RATIO_MINROWS);

  function get_compression_type(ownname IN varchar2,
                                tabname IN varchar2,
                                row_id  IN rowid) return number;

  PROCEDURE incremental_compress(ownname         IN dba_objects.owner%type,
                                 tabname         IN dba_objects.object_name%type,
                                 partname        IN dba_objects.subobject_name%type,
                                 colname         IN varchar2,
                                 dump_on         IN number default 0,
                                 autocompress_on IN number default 0,
                                 where_clause    IN varchar2 default '');

end dbms_compression;

Package created.

SQL> alter package dbms_compression compile body;

Package body altered.

接下来我们通过建立一个基于TPC-D的测试的Schema,保证各表上有较多的数据,并且数据有一定的拟真度:

SQL> select table_name,num_rows,blocks from user_tables ;

TABLE_NAME                       NUM_ROWS     BLOCKS
------------------------------ ---------- ----------
DSS_SUPPLIER                        20000        496
DSS_PART                           400000       7552
DSS_REGION                              5          5
DSS_PARTSUPP                      1600000      29349
DSS_LINEITEM                     12000000     221376
DSS_ORDER                         3000000      48601
DSS_CUSTOMER                       300000       6922
DSS_NATION                             25          5

现在可以进行压缩评估了,我们针对测试模型Schema编辑以下匿名块并运行

SQL> set serveroutput on;
SQL> declare
  cmp_blk_cnt   binary_integer;
  uncmp_blk_cnt binary_integer;
  cmp_rows      binary_integer;
  uncmp_rows    binary_integer;
  cmp_ratio     number;
  cmp_typ       varchar2(100);
BEGIN
  for i in (SELECT TABLE_NAME
              from dba_tables
             where compression = 'DISABLED'
               and owner = 'MACLEAN' and num_rows>1000000) loop
    for j in 1 .. 5 loop
      dbms_compression.get_compression_ratio(scratchtbsname => 'SCRATCH',
                                             ownname        => 'MACLEAN',
                                             tabname        => i.table_name,
                                             partname       => NULL,
                                             comptype       => power(2, j),
                                             blkcnt_cmp     => cmp_blk_cnt,
                                             blkcnt_uncmp   => uncmp_blk_cnt,
                                             row_cmp        => cmp_rows,
                                             row_uncmp      => uncmp_rows,
                                             cmp_ratio      => cmp_ratio,
                                             comptype_str   => cmp_typ);
      dbms_output.put_line(i.table_name || '--' || 'compress_type is ' ||
                           cmp_typ || ' ratio :' ||
                           to_char(cmp_ratio, '99.9') || '%');

    end loop;
  end loop;
end;
/
DSS_ORDER--compress_type is "Compress For OLTP" ratio :  1.1%
Compression Advisor self-check validation successful. select count(*) on both
Uncompressed and EHCC Compressed format = 1000001 rows
DSS_ORDER--compress_type is "Compress For Query High" ratio :  2.7%
Compression Advisor self-check validation successful. select count(*) on both
Uncompressed and EHCC Compressed format = 1000001 rows
DSS_ORDER--compress_type is "Compress For Query Low" ratio :  1.7%
Compression Advisor self-check validation successful. select count(*) on both
Uncompressed and EHCC Compressed format = 1000001 rows
DSS_ORDER--compress_type is "Compress For Archive High" ratio :  2.9%
Compression Advisor self-check validation successful. select count(*) on both
Uncompressed and EHCC Compressed format = 1000001 rows
DSS_ORDER--compress_type is "Compress For Archive Low" ratio :  2.7%
DSS_PARTSUPP--compress_type is "Compress For OLTP" ratio :   .9%
Compression Advisor self-check validation successful. select count(*) on both
Uncompressed and EHCC Compressed format = 1000001 rows
DSS_PARTSUPP--compress_type is "Compress For Query High" ratio :  1.8%
Compression Advisor self-check validation successful. select count(*) on both
Uncompressed and EHCC Compressed format = 1000001 rows
DSS_PARTSUPP--compress_type is "Compress For Query Low" ratio :  1.2%
Compression Advisor self-check validation successful. select count(*) on both
Uncompressed and EHCC Compressed format = 1000001 rows
DSS_PARTSUPP--compress_type is "Compress For Archive High" ratio :  1.9%
Compression Advisor self-check validation successful. select count(*) on both
Uncompressed and EHCC Compressed format = 1000001 rows
DSS_PARTSUPP--compress_type is "Compress For Archive Low" ratio :  1.8%
DSS_LINEITEM--compress_type is "Compress For OLTP" ratio :  1.4%
Compression Advisor self-check validation successful. select count(*) on both
Uncompressed and EHCC Compressed format = 1000001 rows
DSS_LINEITEM--compress_type is "Compress For Query High" ratio :  3.5%
Compression Advisor self-check validation successful. select count(*) on both
Uncompressed and EHCC Compressed format = 1000001 rows
DSS_LINEITEM--compress_type is "Compress For Query Low" ratio :  2.3%
Compression Advisor self-check validation successful. select count(*) on both
Uncompressed and EHCC Compressed format = 1000001 rows
DSS_LINEITEM--compress_type is "Compress For Archive High" ratio :  4.3%
Compression Advisor self-check validation successful. select count(*) on both
Uncompressed and EHCC Compressed format = 1000001 rows
DSS_LINEITEM--compress_type is "Compress For Archive Low" ratio :  3.7%

PL/SQL procedure successfully completed.

可以从上述测试看到,”Compress For Archive High”压缩率最高,该类型最适合于数据归档存储,但其算法复杂度高于”Compress For Archive Low”,压缩耗时亦随之上升。
总体压缩率都较低,这同TPC-D测试的数据建模有一定关联,我们再使用一组TPC-H的测试数据来模拟压缩:

SQL> conn liu/liu;
Connected.

SQL> select num_rows,blocks,table_name from user_tables;

  NUM_ROWS     BLOCKS TABLE_NAME
---------- ---------- ------------------------------
   3000000      46817 H_ORDER
    300000       6040 H_CUSTOMER
  12000000     221376 H_LINEITEM
        25          5 H_NATION
    400000       7552 H_PART
         5          5 H_REGION
   1600000      17491 H_PARTSUPP
     20000        496 H_SUPPLIER

8 rows selected.

SQL> set serveroutput on;
SQL> declare
  cmp_blk_cnt   binary_integer;
  uncmp_blk_cnt binary_integer;
  cmp_rows      binary_integer;
  uncmp_rows    binary_integer;
  cmp_ratio     number;
  cmp_typ       varchar2(100);
BEGIN
  for i in (SELECT TABLE_NAME
              from dba_tables
             where compression = 'DISABLED'
               and owner = 'LIU' and num_rows>1000000) loop
    for j in 1 .. 5 loop
      dbms_compression.get_compression_ratio(scratchtbsname => 'SCRATCH',
                                             ownname        => 'LIU',
                                             tabname        => i.table_name,
                                             partname       => NULL,
                                             comptype       => power(2, j),
                                             blkcnt_cmp     => cmp_blk_cnt,
                                             blkcnt_uncmp   => uncmp_blk_cnt,
                                             row_cmp        => cmp_rows,
                                             row_uncmp      => uncmp_rows,
                                             cmp_ratio      => cmp_ratio,
                                             comptype_str   => cmp_typ);
      dbms_output.put_line(i.table_name || '--' || 'compress_type is ' ||
                           cmp_typ || ' ratio :' ||
                           to_char(cmp_ratio, '99.9') || '%');

    end loop;
  end loop;
end;
/
H_ORDER--compress_type is "Compress For OLTP" ratio :  1.1%
Compression Advisor self-check validation successful. select count(*) on both
Uncompressed and EHCC Compressed format = 1000001 rows
H_ORDER--compress_type is "Compress For Query High" ratio :  5.2%
Compression Advisor self-check validation successful. select count(*) on both
Uncompressed and EHCC Compressed format = 1000001 rows
H_ORDER--compress_type is "Compress For Query Low" ratio :  2.9%
Compression Advisor self-check validation successful. select count(*) on both
Uncompressed and EHCC Compressed format = 1000001 rows
H_ORDER--compress_type is "Compress For Archive High" ratio :  7.2%
Compression Advisor self-check validation successful. select count(*) on both
Uncompressed and EHCC Compressed format = 1000001 rows
H_ORDER--compress_type is "Compress For Archive Low" ratio :  5.5%
H_PARTSUPP--compress_type is "Compress For OLTP" ratio :   .9%
Compression Advisor self-check validation successful. select count(*) on both
Uncompressed and EHCC Compressed format = 1000001 rows
H_PARTSUPP--compress_type is "Compress For Query High" ratio :  5.1%
Compression Advisor self-check validation successful. select count(*) on both
Uncompressed and EHCC Compressed format = 1000001 rows
H_PARTSUPP--compress_type is "Compress For Query Low" ratio :  2.7%
Compression Advisor self-check validation successful. select count(*) on both
Uncompressed and EHCC Compressed format = 1000001 rows
H_PARTSUPP--compress_type is "Compress For Archive High" ratio :  7.2%
Compression Advisor self-check validation successful. select count(*) on both
Uncompressed and EHCC Compressed format = 1000001 rows
H_PARTSUPP--compress_type is "Compress For Archive Low" ratio :  5.3%
H_LINEITEM--compress_type is "Compress For OLTP" ratio :  1.4%
Compression Advisor self-check validation successful. select count(*) on both
Uncompressed and EHCC Compressed format = 1000001 rows
H_LINEITEM--compress_type is "Compress For Query High" ratio :  5.2%
Compression Advisor self-check validation successful. select count(*) on both
Uncompressed and EHCC Compressed format = 1000001 rows
H_LINEITEM--compress_type is "Compress For Query Low" ratio :  3.0%
Compression Advisor self-check validation successful. select count(*) on both
Uncompressed and EHCC Compressed format = 1000001 rows
H_LINEITEM--compress_type is "Compress For Archive High" ratio :  7.4%
Compression Advisor self-check validation successful. select count(*) on both
Uncompressed and EHCC Compressed format = 1000001 rows
H_LINEITEM--compress_type is "Compress For Archive Low" ratio :  5.6%

PL/SQL procedure successfully completed.

可以看到相比TPC-D的测试用数据,TPC-H建立的数据更具可压缩性。

PS:
TPC-D represents a broad range of decision support (DS) applications that require complex, long running queries against large complex data structures. Real-world business questions were written against this model, resulting in 17 complex queries.
The TPC Benchmark™H (TPC-H) is a decision support benchmark. It consists of a suite of business oriented ad-hoc queries and concurrent data modifications. The queries and the data populating the database have been chosen to have broad industry-wide relevance. This benchmark illustrates decision support systems that examine large volumes of data, execute queries with a high degree of complexity, and give answers to critical business questions.
The performance metric reported by TPC-H is called the TPC-H Composite Query-per-Hour Performance Metric (QphH@Size), and reflects multiple aspects of the capability of the system to process queries. These aspects include the selected database size against which the queries are executed, the query processing power when queries are submitted by a single stream, and the query throughput when queries are submitted by multiple concurrent users. The TPC-H Price/Performance metric is expressed as $/QphH@Size.

11gr2 Pseudo-error debugging events

so different from 10gr2,more debugging events added.

for example , event 10949:

10949, 00000, “Disable autotune direct path read for full table scan”

AND

10978, 00000, “general event for materialized view logs”

you can view the event list from HERE.

直接路径读取对于延迟块清除的影响

在Oracle 11g版本中串行的全表扫描可能使用直接路径读取(direct path read)的方式取代之前版本中一直使用的DB FILE SCATTERED READ, 显然direct path read具备更多的优势:

1. 减少了对栓的使用,避免可能的栓争用

2.物理IO的大小不再取决于buffer_cache中所存在的块;试想某个8个块的extent中1,3,5,7号块在高速缓存中,而2,4,6,8块没有被缓存,传统的方式在读取该extent时将会是对2,4,6,8块进行4次db file sequential read,这是一种十分可怕的状况,其效率往往要比单次读取这个区间的所有8个块还要低得多,虽然Oracle为了避免这种情况总是尽可能的不缓存大表的块(读入后总是放在队列最冷的一端);而direct path read则可以完全避免这类问题,尽可能地单次读入更多的物理块。

当然直接路径读取也会引入一些缺点:

1.在直接路径读取某段前需要对该对象进行一次段级的检查点(A segment checkpoint).

2.可能导致重复的延迟块清除操作(我们假设你了解delayed block cleanout是什么).

metalink 文档[ID 793845.1] 对该新版本中的变化进行了描述:

Applies to:

Oracle Server – Enterprise Edition – Version: 11.1.0.6 to 11.1.0.7
This problem can occur on any platform.

Symptoms

After migrating an 11g database from a standalone to a 4-node RAC,  a noticeable
increase of 'direct path read' waits were observed at times.
Here are the Cache sizes and Top 5 events.
waits

Cache Sizes                       Begin        End
~~~~~~~~~~~                  ---------- ----------
               Buffer Cache:     3,232M     3,616M  Std Block Size:         8K
           Shared Pool Size:     6,736M     6,400M      Log Buffer:     8,824K
Top 5 Timed Foreground Events
~~~~~~~~~~~~~~~~~~~~~~~~~~~~~
                                                           Avg
                                                          wait   % DB
Event                                 Waits     Time(s)   (ms)   time Wait Class
------------------------------ ------------ ----------- ------ ------ ----------
DB CPU                                           13,916          42.1
direct path read                  1,637,344      13,359      8   40.4 User I/O
db file sequential read              47,132       1,111     24    3.4 User I/O
DFS lock handle                     301,278       1,028      3    3.1 Other
db file parallel read                14,724         554     38    1.7 User I/O

Changes

Migrated from a standalone database to a 4-node RAC.
Moved from Unix file system storage to ASM.

Using Automatic Shared Memory Management (ASMM).
The setting of db_cache_size in spfile/pfile is low compared to normal workload requirements.

Cause

There have been changes in 11g in the heuristics to choose between direct path reads or reads through buffer cache for serial table scans.
In 10g, serial table scans for “large” tables used to go through cache (by default) which is not the case anymore.  In 11g, this decision to read via direct path or through cache is based on the size of the table, buffer cache size and various other stats.
Direct path reads are faster than scattered reads and have less impact on other processes because they avoid latches.

Solution

When using Automatic Shared Memory Management (ASMM) and with buffer cache low limit set at a low end compared to the normal workload requirements and usually after startup, 11g might choose to do serial direct path read scans for large tables that do not fit in the SGA. When ASMM increases the buffer cache due to increased demand, 11g might not again do serial direct path read scans for these same large tables.  If you like to avoid this from happening, you should note the buffer cache and share pool requirements for a normal workload and set the low limits of buffer cache and shared pool in spfile/pfile close to these normal workload values.
db_cache_size
shared_pool_size

下面我们对直接路径读取对于延迟块清除造成的影响进行测试:

SQL> create table tv as select rownum rn,rpad('A',600,'Z') rp from dual
2       connect by level <=300000;

表已创建。

新建一个会话a:

SQL> set linesize 200 pagesize 1400;
SQL> select count(*) from tv;

COUNT(*)
----------
300000

SQL> select vm.sid, vs.name, vm.value
2    from v$mystat vm, v$sysstat vs
3   where vm.statistic# = vs.statistic#
4     and vs.name in ('cleanouts only - consistent read gets',
5                     'session logical reads',
6                     'physical reads',
7                     'physical reads direct');

SID NAME                                                                  VALUE
---------- ---------------------------------------------------------------- ----------
25 session logical reads                                          27281
25 physical reads                                                 27273
25 physical reads direct                                          27273         
25 cleanouts only - consistent read gets                            0

-- 显然查询采用了直接路径读取方式

SQL> update tv set rn=rn+1;                        -- 尝试批量更新

SQL> alter system flush buffer_cache;             
-- 刷新高速缓存,造成延迟块清除的情景,并提交

系统已更改。

SQL> commit;

提交完成。

新建一个会话b:

SQL> set linesize 200 pagesize 1400;
SQL> select count(*) from tv;

COUNT(*)
----------
300000

SQL> select vm.sid, vs.name, vm.value
2    from v$mystat vm, v$sysstat vs
3   where vm.statistic# = vs.statistic#
4     and vs.name in ('cleanouts only - consistent read gets',
5                     'session logical reads',
6                     'physical reads',
7                     'physical reads direct','redo size');

SID NAME                                                                  VALUE
---------- ---------------------------------------------------------------- ----------
25 session logical reads                                                 54554
25 physical reads                                                        27273
25 physical reads direct                                                 27273
25 redo size                                                                 0
25 cleanouts only - consistent read gets                           27273      
--查询采用direct path read时产生了延迟块清除操作,但不产生redo

SQL> select count(*) from tv;

COUNT(*)
----------
300000

SQL> select vm.sid, vs.name, vm.value
2    from v$mystat vm, v$sysstat vs
3   where vm.statistic# = vs.statistic#
4     and vs.name in ('cleanouts only - consistent read gets',
5                     'session logical reads',
6                     'physical reads',
7                     'physical reads direct','redo size');

SID NAME                                                                  VALUE
---------- ---------------------------------------------------------------- ----------
25 session logical reads                                                109104
25 physical reads                                                        54546
25 physical reads direct                                                 54546
25 redo size                                                                 0
25 cleanouts only - consistent read gets                                 54546

再次查询仍采用直接路径读取,产生了相同数目的延迟块清除操作,并没有产生redo;可见direct path read的清除操作仅是针对从磁盘上读取到PGA内存中的镜像,而不对实际的块做任何修改,因而也没有任何redo;

下面我们使用普通串行全表扫描方式,设置event 10949可以避免采用直接路径读取方式.关于该事件可以参见这里.

SQL> ALTER SESSION SET EVENTS '10949 TRACE NAME CONTEXT FOREVER';

会话已更改。

SQL> select count(*) from tv;

COUNT(*)
----------
300000

SQL> select vm.sid, vs.name, vm.value
2    from v$mystat vm, v$sysstat vs
3   where vm.statistic# = vs.statistic#
4     and vs.name in ('cleanouts only - consistent read gets',
5                     'session logical reads',
6                     'physical reads',
7                     'physical reads direct','redo size');

SID NAME                                                                  VALUE
---------- ---------------------------------------------------------------- ----------
25 session logical reads                                                163662
25 physical reads                                                        81819
25 physical reads direct                                                 54546
25 redo size                                                           1966560
25 cleanouts only - consistent read gets                                 81819

SQL> select count(*) from tv;

COUNT(*)
----------
300000

SQL> select vm.sid, vs.name, vm.value
2    from v$mystat vm, v$sysstat vs
3   where vm.statistic# = vs.statistic#
4     and vs.name in ('cleanouts only - consistent read gets',
5                     'session logical reads',
6                     'physical reads',
7                     'physical reads direct','redo size');

SID NAME                                                                  VALUE
---------- ---------------------------------------------------------------- ----------
25 session logical reads                                                190947
25 physical reads                                                        95673
25 physical reads direct                                                 54546
25 redo size                                                           1966560
25 cleanouts only - consistent read gets                                 81819

第一次采用普通全表扫描方式时产生了与direct path read时相同量的延迟块清除操作,并因此产生了大量的redo,这种模式回归到了最经典的延迟块清除情景中;之后的一次读取则不再需要清除块和产生重做了,我们在读取一个“干净”的表段。

从以上测试我们可以了解到,11g中使用更为广泛的direct path read方式对有需要延迟块清除操作的段所可能产生的影响,因为实际没有一个“修改块”的操作,所以虽然延迟块清除操作在该种模式下每次都必须产生,却实际没有产生脏块,因而也就不会有“写块”的必要,故而也没有redo的产生。所产生的负载可能更多的体现在cpu time的使用上。

ORA-600 [kddummy_blkchk] [18038] 一例

一位客户的Oracle告警日志中出现了ORA-600 [kddummy_blkchk] [18038]故障,alert中的具体信息:

Errors in file /u01/app/oracle/admin/prdw014a/udump/prdw014a_ora_4377.trc:
ORA-00600: internal error code, arguments: [kddummy_blkchk], [222], [5792], [18038], [], [], [], []
Mon May 17 15:27:53 2010
Trace dumping is performing id=[cdmp_20100517152753]
Mon May 17 15:27:53 2010
Doing block recovery for file 2 block 504365
Block recovery from logseq 159276, block 166357 to scn 10934615778284
Mon May 17 15:27:53 2010
Recovery of Online Redo Log: Thread 1 Group 4 Seq 159276 Reading mem 0
Mem# 0: /u01/app/oracle/dataPRDW014/redo04a_1.log
Mem# 1: /u01/app/oracle/dataPRDW014/redo04a_2.log
Block recovery completed at rba 159276.167277.16, scn 2545.3924010007
Doing block recovery for file 222 block 5792
Block recovery from logseq 159276, block 84741 to scn 10934615778283
Mon May 17 15:27:53 2010
Recovery of Online Redo Log: Thread 1 Group 4 Seq 159276 Reading mem 0
Mem# 0: /u01/app/oracle/dataPRDW014/redo04a_1.log
Mem# 1: /u01/app/oracle/dataPRDW014/redo04a_2.log
Block recovery completed at rba 159276.167277.16, scn 2545.3924009964
Mon May 17 15:27:55 2010
Block recovery completed at rba 159276.167277.16, scn 2545.3924009964
Mon May 17 15:27:55 2010
Corrupt Block Found
TSN = 67, TSNAME = OBA_DATA
RFN = 222, BLK = 5792, RDBA = 931141280
OBJN = 1657288, OBJD = 1699775, OBJECT = W_ORG_DS, SUBOBJECT =
SEGMENT OWNER = BMS_OBA_DW, SEGMENT TYPE = Table Segment
Mon May 17 15:32:56 2010
Trace dumping is performing id=[cdmp_20100517153255]

附600错误产生的trace信息:
prdw014a_ora_4377.trc

/u01/app/oracle/admin/prdw014a/udump/prdw014a_ora_4377.trc
Oracle Database 10g Enterprise Edition Release 10.2.0.4.0 - 64bit Production
With the Partitioning, Real Application Clusters, OLAP, Data Mining Scoring Engine
and Real Application Testing options
ORACLE_HOME = /u01/app/oracle/product/102prdw014
System name: SunOS
Node name: v08k405
Release: 5.9
Version: Generic_122300-29
Machine: sun4u
Instance name: prdw014a
Redo thread mounted by this instance: 1
Oracle process number: 109
Unix process pid: 4377, image: oracle@v08k405

*** 2010-05-17 15:23:15.391
*** ACTION NAME:() 2010-05-17 15:23:15.389
*** MODULE NAME:(pmdtm@v04k413 (TNS V1-V3)) 2010-05-17 15:23:15.389
*** SERVICE NAME:(prdw014_taf) 2010-05-17 15:23:15.389
*** SESSION ID:(789.48811) 2010-05-17 15:23:15.389
TYP:0 CLS: 4 AFN:222 DBA:0x378016a0 OBJ:1699775 SCN:0x09f1.e9e3a3eb SEQ: 2 OP:14.4
kteop redo - redo operation on extent map
RESIZE: entry:0 delta:

...
..
..
ksedmp: internal or fatal error
ORA-00600: internal error code, arguments: [kddummy_blkchk], [222], [5792], [18038], [], [], [], []
Current SQL statement for this session:
INSERT /*+ SYS_DL_CURSOR */ INTO bms_oba_dw.W_ORG_DS ("W_CUSTOMER_CLASS","NAME","ST_ADDRESS","CITY","STATE","ZIPCODE","COUNTRY","CUST_TYPE_CODE","CUST_TYPE_NAME","ACTIVE_FLG","DOM_ULT_DUNS_NUM","DUNS_NUM","EMP_COUNT","FORMED_DT","GLBLULT_DUNS_NUM","ANNUAL_REVENUE","BRANCH_FLG","BIRTH_DT","NO_OF_CHILDREN","LEGAL_NAME","FAMILY_NAME","OTHER_NAME","PREFERRED_NAME","INDV_ADDNL_TITLE","INDV_TITLE","INDV_MARITAL_STATE","INDV_GENDER","EMAIL_ADDRESS","RELATIONSHIP_STATE","INDV_EMP_STATUS","FAX_NUM","PAGER_NUM","MOBILE_NUM","LIFE_CYCLE_STATE","CUST_CAT_CODE","CUST_CAT_NAME","SIC_CODE","SIC_NAME","GOVT_ID_TYPE","GOVT_ID_VALUE","DUNNS_SITE_NAME","DUNNS_GLOBAL_NAME","DUNNS_LEGAL_NAME","CUSTOMER_NUM","ALT_CUSTOMER_NUM","ALT_PHONE_NUM","INTERNET_HOME_PAGE","LEGAL_STRUCT_CODE","LEGAL_STRUCT_NAME","DIRECT_MKTG_FLG","SOLICITATION_FLG","CUSTOMER_HIER1_CODE","CUSTOMER_HIER1_NAME","CUSTOMER_HIER2_CODE","CUSTOMER_HIER2_NAME","CUSTOMER_HIER3_CODE","CUSTOMER_HIER3_NAME","CUSTOMER_HIER4_CODE","CUSTOMER_HIER4_NAME","CUSTOMER_HIER5_CODE","CUSTOMER_HIER5_NAME","CUSTOMER_HIER6_CODE","CREATED_BY_ID","CHANGED_BY_ID","CREATED_ON_DT","CHANGED_ON_DT","AUX1_CHANGED_ON_DT","AUX2_CHANGED_ON_DT","AUX3_CHANGED_ON_DT","AUX4_CHANGED_ON_DT","SRC_EFF_FROM_DT","SRC_EFF_TO_DT","DELETE_FLG","DATASOURCE_NUM_ID","INTEGRATION_ID","TENANT_ID","X_CUSTOM","MOT_ATTRIBUTE1","MOT_ATTRIBUTE2","MOT_ATTRIBUTE3","MOT_ATTRIBUTE4","MOT_ATTRIBUTE5","MOT_ATTRIBUTE6","MOT_ATTRIBUTE7","MOT_ATTRIBUTE8","MOT_ATTRIBUTE9","MOT_ATTRIBUTE10","MOT_ATTRIBUTE11","MOT_ATTRIBUTE12","MOT_ATTRIBUTE13","MOT_ATTRIBUTE14","MOT_ATTRIBUTE15","MOT_ATTRIBUTE16","MOT_ATTRIBUTE17","MOT_ATTRIBUTE18","MOT_ATTRIBUTE19","MOT_ATTRIBUTE20","MOT_PARTY_TYPE","MOT_PHONE_AREA_CODE","MOT_ORIG_SYSTEM_REFERENCE","MOT_PER_EMAIL_ADDR","MOT_PERSON_FIRST_NAME","MOT_PHONE_EXTENSION","MOT_ALTERNATE_NAME","MOT_TELEPHONE_TYPE","MOT_SALES_CHANNEL_CODE","MOT_ACCOUNT_NAME","MOT_ATTRIBUTE_CATEGORY","MOT_INTERCOMPANY_FLAG","MOT_PARTY_NUMBER","MOT_PARTY_ID","MOT_LAST_UPDATE_LOGIN","MOT_CUST_CLASS_DESC","MOT_RECEIPT_METHOD_NAME","MOT_PHONE_NUMBER","MOT_CONTACT_POINT_PURPOSE","MOT_SALESREP_NAME","MOT_PAY_TERMS_CODE","MOT_PAY_TERMS_NAME") VALUES (NULL,NULL,NULL,NULL,NULL,NULL,NULL,NULL,NULL,NULL,NULL,NULL,NULL,NULL,NULL,NULL,NULL,NULL,NULL,NULL,NULL,NULL,NULL,NULL,NULL,NULL,NULL,NULL,NULL,NULL,NULL,NULL,NULL,NULL,NULL,NULL,NULL,NULL,NULL,NULL,NULL,NULL,NULL,NULL,NULL,NULL,NULL,NULL,NULL,NULL,NULL,NULL,NULL,NULL,NULL,NULL,NULL,NULL,NULL,NULL,NULL,NULL,NULL,NULL,NULL,NULL,NULL,NULL,NULL,NULL,NULL,NULL,NULL,NULL,NULL,NULL,NULL,NULL,NULL,NULL,NULL,NULL,NULL,NULL,NULL,NULL,NULL,NULL,NULL,NULL,NULL,NULL,NULL,NULL,NULL,NULL,NULL,NULL,NULL,NULL,NULL,NULL,NULL,NULL,NULL,NULL,NULL,NULL,NULL,NULL,NULL,NULL,NULL,NULL,NULL,NULL,NULL,NULL,NULL)
----- Call Stack Trace -----
calling              call     entry                argument values in hex
location             type     point                (? means dubious value)
-------------------- -------- -------------------- ----------------------------
ksedmp()+744         CALL     ksedst()             000000840 ?
                                                   FFFFFFFF7FFF620C ?
                                                   000000000 ?
                                                   FFFFFFFF7FFF2D00 ?
                                                   FFFFFFFF7FFF1A68 ?
                                                   FFFFFFFF7FFF2468 ?
kgerinv()+200        PTR_CALL 0000000000000000     000106800 ? 10681C1C4 ?
                                                   10681C000 ? 00010681C ?
                                                   000106800 ? 10681C1C4 ?
kseinpre()+96        CALL     kgerinv()            106816B18 ? 000000000 ?
                                                   1064564C0 ? 000000003 ?
                                                   FFFFFFFF7FFF6750 ?
                                                   000001430 ?
ksesin()+52          CALL     kseinpre()           000106800 ? 000000003 ?
                                                   00000025F ? 10681C1B8 ?
                                                   FFFFFFFF7FFF6750 ?
                                                   1068167D8 ?
kco_blkchk()+2568    CALL     ksesin()             1064564C0 ? 000000003 ?
                                                   000106800 ? 0000000DE ?
                                                   000000000 ? 000106800 ?
kcoapl()+1284        CALL     kco_blkchk()         0001900DE ? 0378016A0 ?
                                                   0000016A0 ? 00000FC00 ?
                                                   000000000 ?
                                                   FFFFFFFF7FFF89F8 ?
kcbapl()+412         CALL     kcoapl()             000000002 ? 000002300 ?
                                                   000105800 ? 583DBC000 ?
                                                   106816C98 ? 00010598F ?
kcrfw_redo_gen()+16  CALL     kcbapl()             FFFFFFFF7FFF89B8 ?
376                                                583FB7870 ?
                                                   FFFFFFFF7AF3AA3C ?
                                                   B6E9FABD0 ? 000000000 ?
                                                   583DBC000 ?
kcbchg1_main()+1363  CALL     kcrfw_redo_gen()     000000000 ?
2                                                  FFFFFFFF7FFF76C8 ?
                                                   B693A9998 ? 000000000 ?
                                                   3800135A0 ?
                                                   FFFFFFFF7FFF7700 ?
kcbchg1()+1324       CALL     kcbchg1_main()       000100C00 ?
                                                   FFFFFFFF7FFF7850 ?
                                                   000000000 ? 583FB7870 ?
                                                   000000000 ? 00000FFFF ?
ktuchg()+968         CALL     kcbchg1()            000106819 ? 1068195B8 ?
                                                   1068195C8 ? 106819000 ?
                                                   000000000 ? 106819000 ?
ktbchg2nt()+104      CALL     ktuchg()             000000002 ? 000000001 ?
                                                   FFFFFFFF7FFF8928 ?
                                                   B67A76DD8 ? 000000000 ?
                                                   000000000 ?
kteopgen()+728       CALL     ktbchg2nt()          FFFFFFFF7FFF89B8 ?
                                                   FFFFFFFF7FFF87C4 ?
                                                   000000000 ? 000000000 ?
                                                   FFFFFFFF7FFF8928 ?
                                                   FFFFFFFF7FFF9D98 ?
kteopresize()+2276   CALL     kteopgen()           FFFFFFFF7FFF89B8 ?
                                                   000000006 ? 000106800 ?
                                                   000000002 ? 10682247C ?
                                                   106816B18 ?
ktsxbmdelext1()+968  CALL     kteopresize()        FFFFFFFF7FFF9D98 ?
8                                                  FFFFFFFF7FFF9E88 ?
                                                   000000004 ? 000000002 ?
                                                   000000000 ? 000000000 ?
ktsstrm_segment()+6  CALL     ktsxbmdelext1()      FFFFFFFF7AD33A78 ?
308                                                0000016A0 ? 0003FFFFF ?
                                                   FFFFFFFF7AD33A78 ?
                                                   106822000 ? 000000043 ?
ktsmg_trimf()+1208   CALL     ktsstrm_segment()    000000000 ? 000000003 ?
                                                   000000001 ? 000100C00 ?
                                                   106819000 ? 000000000 ?
kdbltrmt()+1916      CALL     ktsmg_trimf()        00010598F ? 0000010E2 ?
                                                   106822478 ? 000000005 ?
                                                   10682247C ? 106816B18 ?
kdblfpl()+96         CALL     kdbltrmt()           000000006 ? 000000000 ?
                                                   FFFFFFFF7AD33918 ?
                                                   000000180 ? 0000010E4 ?
                                                   000000008 ?
kdblfl()+1948        CALL     kdblfpl()            FFFFFFFF7FFFB0AC ?
                                                   FFFFFFFF7AD33918 ?
                                                   000000000 ?
                                                   FFFFFFFF7AD33AE0 ?
                                                   FFFFFFFF7AD33A68 ?
                                                   000000000 ?
klafin()+160         CALL     kdblfl()             FFFFFFFF7FFFB0AC ?
                                                   FFFFFFFF7AD33918 ?
                                                   000000000 ? 000000001 ?
                                                   000000008 ? 000106800 ?
kpodpfin()+76        CALL     klafin()             FFFFFFFF7AF35C40 ?
                                                   1059BF2B8 ? 000000321 ?
                                                   FFFFFFFF7AD33918 ?
                                                   000000000 ? 000400000 ?
kpodpmop()+320       CALL     kpodpfin()           FFFFFFFF7AF35C40 ?
                                                   000106816 ? 000106800 ?
                                                   000000321 ? 000000001 ?
                                                   FFFFFFFF7AF35BC8 ?
opiodr()+1496        PTR_CALL 0000000000000000     000000301 ? 000000321 ?

进过与Oracle support确认,定位为Bug 5386204 – Block corruption / OERI[kddummy_blkchk] after direct load of ASSM segment [ID 5386204.8].
“kteop redo – redo operation on extent map” 记录是确定该Bug的一个重要依据。

该Bug的Oracle note:

Bug 5386204  Block corruption / OERI[kddummy_blkchk] after direct load of ASSM segment
This note gives a brief overview of bug 5386204.
The content was last updated on: 08-FEB-2010
Click here for details of each of the sections below.
This bug is alerted in Note:580561.1
Affects:

Product (Component)    Oracle Server (Rdbms)
Range of versions believed to be affected    Versions < 11
Versions confirmed as being affected

* 9.2.0.8
* 10.2.0.1
* 10.2.0.2
* 10.2.0.3
* 10.2.0.4

Platforms affected    Generic (all / most platforms affected)

Fixed:

This issue is fixed in

* 9.2.0.8 Patch 15 on Windows Platforms
* 10.2.0.2 Patch 15 on Windows Platforms
* 10.2.0.3 Patch 5 on Windows Platforms
* 10.2.0.4.1 (Patch Set Update)
* 10.2.0.4 Patch 2 on Windows Platforms
* 10.2.0.5 (Server Patch Set)
* 11.1.0.6 (Base Release)

Symptoms:

Related To:

* Internal Error May Occur (ORA-600)
* Corruption (Logical)
* ORA-600 [kddummy_blkchk]

* Direct Path Operations
* ASSM Space Management (Bitmap Managed Segments)

Description

Block corruption / ORA-600 [kddummy_blkchk][file#] [block#] [18038]
can occur on a segment which has been direct loaded.

(The corruption shows as a PAGETABLE SEGMENT HEADER
having blocks in the “Auxillary Map” outside of the “Extent Map”
range)

Note:
This bug was previously incorrectly listed as fixed in 10.2.0.4

Further details on this issue can be found in Note:580561.1
ORA-600 [kddummy_blkchk][][][18038] during extent operations like TRUNCATE on ASSM tablespaces [ID 580561.1]

Applies to:
Oracle Server – Enterprise Edition – Version: 9.2.0.8 to 10.2.0.4
Information in this document applies to any platform.
Description

This alert describes the problem in Bug 5386204 / Note 5386204.8.

Block corruption with error ORA-600 [kddummy_blkchk] [file#] [block#] [18038]
may be reported during a DROP/TRUNCATE

The corruption shows as a PAGETABLE SEGMENT HEADER having blocks in the
“Auxillary Map” outside of the “Extent Map” range.

The same operation terminated without any error in previous RDBMS versions
like Oracle9i.

Likelihood of Occurrence

The object is populated by direct path operations such as SQL*Loader using DIRECT=Y for example.
The object is stored in a Locally Managed Tablespace (LMT) that is using ASSM (dba_tablespaces.segment_space_management=’AUTO’).
Bug 5386204 is mostly hit when db_block_size=16384.

Possible Symptoms

One evidence of hitting this bug might be the value 18038 in the third argument of
ORA-600 [kddummy_blkchk] where [18038] is a check error code.

@Error check code 18038 means that the “Data dba” stored in “Auxiliary Map” is out of range

@TYP:0 CLS: 4 AFN:234 DBA:0x3a801554 OBJ:0 SCN:0x000b.290f5e0d SEQ:  1 OP:14.2

@In this case “Data dba: 0x3a801555” stored in the “Auxiliary Map” is equal to 0x3a801551 + 4 which is out of the extent 0, hence the error.
@Note that extent 0 is 4 blocks, so extent 0 starts from 0x3a801551 to 0x3a801554.

Workaround or Resolution

In order to identify objects that are affected by the corruption, use the procedure
DBMS_SPACE_ADMIN.ASSM_TABLESPACE_VERIFY

@DBMS_SPACE_ADMIN.ASSM_SEGMENT_VERIFY is also an option but it requires patch for Bug 6760697 is needed)

How to execute DBMS_SPACE_ADMIN.ASSM_TABLESPACE_VERIFY:

alter system set DB_BLOCK_CHECKSUM = OFF;
— open a new session and run :
exec DBMS_SPACE_ADMIN.assm_tablespace_verify(‘<Tablespace Name>’, DBMS_SPACE_ADMIN.TS_VERIFY_DEEP, DBMS_SPACE_ADMIN.SEGMENT_VERIFY_DEEP);

See if any trace file is generated in the directory defined by user_dump_dest.
The absence of a trace file means that no corrupt segments were found.

Note: DB_BLOCK_CHECKSUM has to be disabled; otherwise the same ORA-600 error may be produced

@Oracle check block type 0x23=PAGETABLE SEGMENT HEADER even if DB_BLOCK_CHECKING is not set.

Example of output from DBMS_SPACE_ADMIN.ASSM_TABLESPACE_VERIFY

Segment header [dba: 0x003a801554, (file 234,block 5460)]
Segment object id: 7825838; inc. no.: 0
*********

verifying extent map and tablespace bitmap consistency
———
Verifying extent map and  auxilliary extent map   consistency in   the segment
Block Corruption in seg hdr / ext map block:                rdba: 0x3a801554, err code: 18038

Identifying the object using the segment header information.

Segment header [dba: 0x003a801554, (file 234,block 5460)]

select *
from DBA_EXTENTS
where FILE_ID = 234
and 5460 between block_id and block_id + blocks – 1;

Identifying the object using the Segment object id information.

Segment object id: 7825838; inc. no.: 0

select *
from DBA_OBJECTS
where DATA_OBJECT_ID = 7825838;

@How to execute DBMS_SPACE_ADMIN.ASSM_SEGMENT_VERIFY

WORKAROUNDs:

Disable DB_BLOCK_CHECKSUM for any action taken.

Note: DB_BLOCK_CHECKSUM has to be disabled; otherwise the same ORA-600 error may be produced

alter system set DB_BLOCK_CHECKSUM = OFF;
— open a new session

DROP TABLE .. PURGE;
ALTER TABLE .. MOVE ..;
Create table as select (CTAS)
export/import, etc

Patches

The patch prevents the corruption from taking place. Affected objects will have to be recreated.

This bug was previously incorrectly listed as fixed in 10.2.0.4.

@This problem is fixed in the 10.2.0.5 Patch Set (not available yet and still without a due date).
This problem is fixed in the 11.1.0.6 rdbms release.

One off patches for this issue are available for some platforms / versions.

See Patch 5386204 for patch availability.

Modification History

03-JUN-2008 – Initial Alert version
04-JUN-2008 – Implemented correction
11-JUN-2008 – Added info about DB_BLOCK_CHECKSUM
13-JUN-2008 – Published

References

BUG:5386204 – ORA-600 [KDDUMMY_BLKCHK] ERRORS WITH CODE 18038

NOTE:5386204.8 – Bug 5386204 – Block corruption / OERI[kddummy_blkchk] after direct load of ASSM segment

Bug 5386204: ORA-600 [KDDUMMY_BLKCHK] ERRORS WITH CODE 18038

Show Bug Attributes Bug Attributes
Type     B – Defect     Fixed in Product Version     11.1
Severity     1 – Complete Loss of Service     Product Version     10.2.0.2
Status     80 – Development to Q/A     Platform     226 – Linux x86-64
Created     12-Jul-2006     Platform Version     2.6.5-7.191-SMP
Updated     20-May-2010     Base Bug     –
Database Version     10.2.0.2
Affects Platforms     Generic
Product Source     Oracle

Show Related Products Related Products
Line     Oracle Database Products     Family     Oracle Database
Area     Oracle Database     Product     5 – Oracle Server – Enterprise Edition

Hdr: 5386204 10.2.0.2 RDBMS 10.2.0.2 SPACE PRODID-5 PORTID-226 ORA-600
Abstract: ORA-600 [KDDUMMY_BLKCHK] ERRORS WITH CODE 18038

*** 07/12/06 12:59 am ***
TAR:
—-

PROBLEM:
——–
1. Clear description of the problem encountered
Customer is getting repeated ORA-600 [kddummy_blkchk] errors reported with
internal check code 18038 on tables which have had bulk deletions made.  This
has occurred on both production and test instances.

2. Pertinent configuration information (MTS/OPS/distributed/etc)
RAC, ASM

3. Indication of the frequency and predictability of the problem
Problem is intermittent but occurs several times a day impacting the
customers ability to work.

4. Sequence of events leading to the problem
Error is typically signalled on a COMMIT most likely following a deletion
from the tables.

5. Technical impact on the customer. Include persistent after effects.
Severe, as it occurs multiple times per day, and corrupt the underlying
tables preventing further data loads.

DIAGNOSTIC ANALYSIS:
——————–
The trace files show that the problem occurs following a bulk deletion from
the underlying tables, which appear to corrupt the extent map, as the segment
header dump shows 1 extent of 4 blks, but the deleteion entry in the redo
stream shows one extent of 8 blks, e.g.:

REDO RECORD – Thread:1 RBA: 0x0005da.000e5e34.01c0 LEN: 0x00fc VLD: 0x01
SCN: 0x000d.37eacce9 SUBSCN:  5 07/11/2006 10:29:53
CHANGE #1 TYP:0 CLS:60 AFN:39 DBA:0x09c322e0 OBJ:4294967295
SCN:0x000d.37eacce9 SEQ:  2 OP:5.1
ktudb redo: siz: 112 spc: 15940 flg: 0x0022 seq: 0x011d rec: 0x06
xid:  0x0016.020.000005b6
ktubu redo: slt: 32 rci: 5 opc: 14.5 objn: 2 objd: 93662 tsn: 12
Undo type:  Regular undo       Undo type:  Last buffer split:  No
Tablespace Undo:  Yes
0x00000000
kteopu undo – undo operation on extent map
segdba: 0x87e3cc  class: 4  mapdba:0x87e3cc  offset: 3
rbr extent – dba: 0x0  nbk: 0x0
kteop redo – redo operation on extent map
ADD: dba:0x803673d len:8 at offset:1
DEFAULT: ???
SETSTAT: exts:2 blks:16 lastmap:0x0 mapcnt:0
CHANGE #2 TYP:0 CLS: 4 AFN:2 DBA:0x0087e3cc OBJ:93662 SCN:0x000d.37eacce9
SEQ:  1 OP:14.4
kteop redo – redo operation on extent map
DELETE: entry:1
shift back: dba:0x0 len:0
SETSTAT: exts:1 blks:8 lastmap:0x0 mapcnt:0

WORKAROUND:
———–
None

RELATED BUGS:
————-
Bug 4949123 – ORA-600: [KDDUMMY_BLKCHK], [541], [147050], [18038]

REPRODUCIBILITY:
—————-
Consistently occurring at customers site.

TEST CASE:
———-
n/a

STACK TRACE:
————
ksedst ksedmp ksfdmp kgerinv kseinpre ksesin kco_blkchk kcoapl kcbapl
kcrfw_redo_gen kcbchg1_main kcbchg1 ktuchg ktbchg2nt kteopgen kteopresize
ktsxbmdelext1 ktsstrm_segment ktsmg_icmt_prepare ktcifc ktucmt ktpcmt ktcrcm
ktdcmt k2lcom k2send xctctl xctcom_with_options kksExecuteCommand opiexe
opipls opiodr rpidrus skgmstack rpidru rpiswu2 rpidrv psddr0 psdnal
pevm_EXECC pfrinstr_EXECC pfrrun_no_tool pfrrun plsql_run peicnt kkxexe
opiexe kpoal8 opiodr ttcpip opitsk opiino opiodr opidrv sou2o opimai_real
main __libc_start_main _start

SUPPORTING INFORMATION:
———————–
alertlogs and trace files

24 HOUR CONTACT INFORMATION FOR P1 BUGS:
—————————————-
n/a

DIAL-IN INFORMATION:
——————–
n/a

IMPACT DATE:
————
21-JUL-2006

*** 07/12/06 02:34 am *** (CHG: Asg->NEW OWNER OWNER)

A redo dump of the segment header during the entire procedure execution was
requested on 06 Aug and supplied on 09 Aug so why are you asking for this
information again when you already have it?  Please check that file
(redo_1.trc in bug5386204_07Aug.zip), and let me know if you need anything
else.
*** 09/19/06 02:39 am *** (CHG: Sta->30)
Uploaded the requested information in file bug5386204_Oct02.zip.

*** 11/27/06 11:13 am ***
Here is one theory we (space group) have on this bug so far:
During direct load one of the segments does not get loaded with any data. The
segment is empty and the first extent has 8 blocks (this is 16k block size).
However it goes through the usual high water mark movement phase (even though
the hwm does not move). During the hwm movement phase, the segment is trimmed
close to 64k boundary. For ASSM segment with 16k block size, this means the
segment will be left with no data blocks after the trim- 4 blocks after the
trim would represent bitmaps and segment header only.

There are two issues here:
(1) Why was ktsstrm_segment called on an empty (or unloaded) segment at first
place?
(2) Even if it was called, why is segment trimmed to 64k boundary?

I’m working on the 2nd issue and will give an update soon.
*** 11/29/06 03:18 am *** (CHG: Pri->1)
*** 11/29/06 03:18 am ***
*** 11/29/06 03:25 am *** -> CLOSED
*** 11/29/06 05:31 pm ***
*** 11/30/06 10:36 pm ***
We ran into some issues (bugs) while testing the code for the diagnostic
patch. I was hoping to have it finished by today but it seems it’ll take some
more time and I’m pretty hopeful of having it ready to go by tomorrow evening
(PST). I’m really sorry for the delay.
*** 12/01/06 07:16 pm ***
*** 12/02/06 05:05 pm ***
Sorry for the delay in replying. I would expect the long regressions to be
complete by sunday afternoon PST. I should be ready to release the patch by
sunday evening if things go fine. Will keep this page updated on my progress.
*** 12/03/06 05:30 pm ***
*** 12/04/06 05:35 pm ***
It seems most of major issues with the long regressions have been taken care
of and I hope to get a clean run on the farm soon, by tomorrow end of day and
the patch should be on its way soonafter.

I had a question though, that will help me in getting the patch out faster. I
wanted to know if the customer has had any diagnosibility patches installed
on their 10.2.0.2.0 release version.

Another thing which I would like to mention here is that my patch modifies
only one file (ktss.c) in the RDBMS code.
*** 12/05/06 02:19 am ***
*** 12/05/06 04:42 pm ***
*** 12/05/06 05:06 pm ***
I was hoping to have all the farm regressions (and the patch) done by today
evening but it seems farm is taking a bit long to finish the regressions.
I’ll work on the patch as soon as I have the regressions done. Sorry for the
delay. I’ll provide an update on that in the next few hours.
*** 12/05/06 09:07 pm ***
My regressions are still moving very slowly through the queue on the farm.
The farm seems to be busy with 11g Beta 4 deadline round the corner. My
regressions have been on the farm for more than a day now. I’ll work on the
patch as soon as I have a clean farm run.
*** 12/06/06 06:15 pm ***
Still waiting on the clean farm runs. Fortunately, I’ve been able to get a
high priority on the farm jobs. So, I expect things to run clean soon. Will
keep things updated here.
*** 12/07/06 05:54 pm ***
Got my farm runs completed last night but got a small number of diffs. Have
been trying to isolate them and hopefully soon, everything should be clean.
Farm has been giving those diffs over and over again though those look
unrelated to my change. Currently, verifying them on my linux workstation.
*** 12/08/06 06:01 pm ***
*** 12/08/06 06:23 pm ***
Have been able to run almost all the long regressions locally and things look
clean. There’s just a couple of long regressions which I’m still running and
I should expect to be ready to go as soon as they are completed. Should be
able to start the patch building soon.
*** 12/11/06 01:07 am ***
There’s one long regression which seems to be broken. I’m currently working
on that to have it run clean. Will update as soon as I have it running clean.
*** 12/11/06 01:23 pm ***
Everything is clean now. Working on starting the patch building process.
*** 12/11/06 02:46 pm ***

The customer has confirmed that following application of the suplied patch
the error no longer occurred when running the testcase, which ran through to
completion after about 8 hours.  They are resetting the testcase, and will
run it again to verify this, but the initial response is that this looks to
have resolved the problem.

Can you confirm if the patch would need to be rebuilt as a permananent fix,
ie. any diagnostics to be removed etc. or is it actually the full fix anyway?
*** 12/13/06 07:19 am ***
The customer has confirmed the following:

1. Rerun the test for the 2nd time with patched rdbms: completed quickly and
without any problems.
2. Rollbacked the patch: the test failed as expected within 30 minutes.
3. Re-applied the patch and ran the test once again: completed ok.

This appears to confirm that the patch resolves the problem so could we have
an answer to the previous update?
*** 12/13/06 07:47 pm ***
That is good news.
No additional diagnostics have been added to the patch. So, it’s not needed
to be rebuilt. I guess the supplied patch should be complete in itself.
*** 12/14/06 12:40 am ***
Thanks for the update.

该文档描述当使用直接路径方式导入数据时一定概率导致该Bug产生,譬如使用Sql loader且DIRECT=Y;
该Bug只会由存贮在本地管理方式(LTM)并自动段管理(ASSM)的对象引发, 并且当标准块大小为16k时出现概率较高(Bug 5386204 is mostly hit when db_block_size=16384.)
一般数据库都会启用db_block_checksum,该参数控制Oracle在读入块时做检验操作,[18038]是kddummy_blkchk的一种错误代码,出现该错误代码说明存储在段头中的辅助区间图中的Data dba越界, 我们举一个段头来看:

Start dump data blocks tsn: 4 file#: 4 minblk 139 maxblk 139
buffer tsn: 4 rdba: 0x0100008b (4/139)
scn: 0x0000.000f327e seq: 0x01 flg: 0x04 tail: 0x327e2301
frmt: 0x02 chkval: 0x619e type: 0x23=PAGETABLE SEGMENT HEADER
Hex dump of block: st=0, typ_found=1
.......
  Extent Control Header
  -----------------------------------------------------------------
  Extent Header:: spare1: 0      spare2: 0      #extents: 9      #blocks: 72
                  last map  0x00000000  #maps: 0      offset: 2716
      Highwater::  0x0101e1f1  ext#: 8      blk#: 8      ext size: 8
  #blocks in seg. hdr's freelists: 0
  #blocks below: 65
  mapblk  0x00000000  offset: 8
                   Unlocked
  --------------------------------------------------------
  Low HighWater Mark :
      Highwater::  0x0101e1f1  ext#: 8      blk#: 8      ext size: 8
  #blocks in seg. hdr's freelists: 0
  #blocks below: 65
  mapblk  0x00000000  offset: 8
  Level 1 BMB for High HWM block: 0x0101e1e9
  Level 1 BMB for Low HWM block: 0x0101e1e9
  --------------------------------------------------------
  Segment Type: 1 nl2: 1      blksz: 8192   fbsz: 0
  L2 Array start offset:  0x00001434
  First Level 3 BMB:  0x00000000
  L2 Hint for inserts:  0x0100008a
  Last Level 1 BMB:  0x0101e1e9
  Last Level II BMB:  0x0100008a
  Last Level III BMB:  0x00000000
     Map Header:: next  0x00000000  #extents: 9    obj#: 51806  flag: 0x10000000
  Inc # 0
  Extent Map
  -----------------------------------------------------------------
   0x01000089  length: 8
   0x0101e1a1  length: 8
   0x0101e1a9  length: 8
   0x0101e1b9  length: 8
   0x0101e1c1  length: 8
   0x0101e1c9  length: 8
   0x0101e1d9  length: 8
   0x0101e1e1  length: 8
   0x0101e1e9  length: 8

  Auxillary Map
  --------------------------------------------------------
   Extent 0     :  L1 dba:  0x01000089 Data dba:  0x0100008c
   Extent 1     :  L1 dba:  0x01000089 Data dba:  0x0101e1a1
   Extent 2     :  L1 dba:  0x0101e1a9 Data dba:  0x0101e1aa
   Extent 3     :  L1 dba:  0x0101e1a9 Data dba:  0x0101e1b9
   Extent 4     :  L1 dba:  0x0101e1c1 Data dba:  0x0101e1c2
   Extent 5     :  L1 dba:  0x0101e1c1 Data dba:  0x0101e1c9
   Extent 6     :  L1 dba:  0x0101e1d9 Data dba:  0x0101e1da
   Extent 7     :  L1 dba:  0x0101e1d9 Data dba:  0x0101e1e1
   Extent 8     :  L1 dba:  0x0101e1e9 Data dba:  0x0101e1ea
  --------------------------------------------------------

   Second Level Bitmap block DBAs
   --------------------------------------------------------
   DBA 1:   0x0100008a

其中辅助区间图( Auxillary Map)列出了该段每个区间(Extent)的一级位图块以及区间中实际数据开始的data block address (Data dba).譬如Extent 0 中的Data dba应在
(0x0100008A ~0x01000090)之间,否则即越界。
DROP或TRUNCATE是触发该Bug的主要操作,原因是这2个操作都需要使用到Pagetable segment header中的Auxiliary Map。
Oracle建议的WorkAround方式主要是通过MOVE TABLESPACE 来”REBUILD”这个PAGETABLE SEGMENT HEADER。
这个Case中Oracle support给出Workaround建议:

1-. Make sure the below query will return the table mentioned above:

SQL> select owner, object_name, object_type, SUBOBJECT_NAME, OBJECT_ID,
DATA_OBJECT_ID, CREATED,LAST_DDL_TIME,TIMESTAMP
from DBA_OBJECTS
where DATA_OBJECT_ID =1699775;

If so continue:

SQL>alter system set DB_BLOCK_CHECKSUM = OFF;

Find all indexes for W_ORG_DS table.

SQL> select owner, index_name, index_type, table_name , table_owner from dba_indexes
Where table_owner = ‘BMS_OBA_DW’ and
Table_name = ‘W_ORG_DS’;

connect as BMS_OBA_DW

SQL> desc W_ORG_DS

if this table does not have LONG column, then Alter table table_name move is like a CTAS but better since is using the same name of the object plus keeping any related object like index, etc. If it has Long column then export/truncate/import need to be use;

SQL>Alter table W_ORG_DS Move;

Then rebuild all indexes for W_ORG_DS table as per above query: .i.e.

SQL>Alter index rebuild

To avoid problem, please apply patch for bug 5386204, see note 580561.1 for further information.

Oracle文档宣称其已在10.2.0.4的第一个patch set update及10.2.0.5中修复了该Bug.

注:最早认为该Bug在10.2.0.4中就已经修复了,但后来确认“This bug was previously incorrectly listed as fixed in 10.2.0.4”。

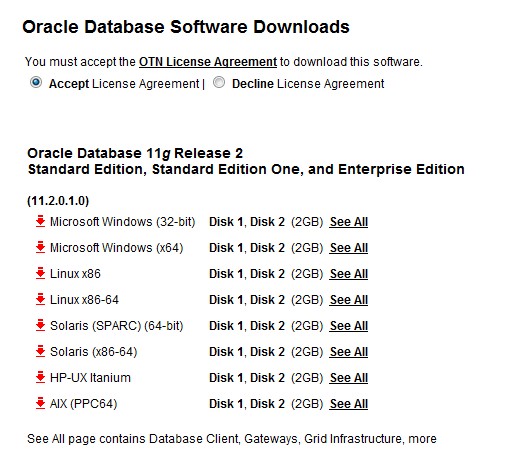
windows平台上的11g release 2终于发布了

下午无意中打开了oracle主页上11g下载的页面,赫然发现windows平台的安装介质已经发布了。

介质分成2个zip包,1.5g和600m; 11g的安装介质较10g大了许多,因为默认附加了apex与sql developer.

下载地址:

Oracle Database 11g Release 2 (11.2.0.1.0) for Microsoft Windows (32-bit)
Download win32_11gR2_database_1of2.zip (1,625,721,289 bytes)
Download win32_11gR2_database_2of2.zip (631,934,821 bytes)
Oracle Database 11g Release 2 (11.2.0.1.0) for Microsoft Windows (x64)
Download win64_11gR2_database_1of2.zip (1,213,501,989 bytes) (cksum – 3906682109)
Download win64_11gR2_database_2of2.zip (1,007,988,954 bytes) (cksum – 1232608515)

目前32位未提供grid infrastructure 介质,想要体验windows上的11g rac只能使用64bit .

Oracle Database 11g Release 2 Grid Infrastructure (11.2.0.1.0) for Microsoft Windows (x64)

Download win64_11gR2_grid.zip (715,166,425 bytes) (cksum – 3127109177)

根据metalink文档867040.1所述,Oracle database 11g release 2 将默认支持windows 7 以及 windows 2008 r2 .

单机的安装过程十分简单:

一般来说windows 发行版在正式生产环境中不多见,不过安装到笔记本上方便了今后对11gr2新特性的测试。

附release note:

Oracle Database 11g Release 2 Now Available on Windows 32 and 64-bit [ID 1081390.1]

Modified 07-APR-2010     Type ANNOUNCEMENT     Status PUBLISHED

In this Document
What is being announced?
References


Applies to:

Oracle Server – Standard Edition – Version: 11.2.0.1 – Release: 11.2
Oracle Server – Personal Edition – Version: 11.2.0.1 – Release: 11.2
Oracle Server – Enterprise Edition – Version: 11.2.0.1 – Release: 11.2
Microsoft Windows (32-bit)
Microsoft Windows x64 (64-bit)
Microsoft Windows x64 (64-bit) – OS Version: 7
Microsoft Windows (32-bit) – OS Version: 7
Microsoft Windows x64 (64-bit) – Version: 2008 R2

What is being announced?

Oracle Database 11g Release 2 for Windows x86 (32-bit) and x86-64 is now available for download from OTN or the Oracle Store.

New with 11.2 is certification with Windows 2008 R2 and Windows 7.   You can find out more in Note  1065024.1 “Oracle Database 11g Release 2 Certification Highlights”.

What’s preconnect.svc in 11g RAC?

有网友反映在11.2的RAC中有一个名如*_preconnect.svc的资源一直处于OFFLINE状态,而其TARGET则为ONLINE状态,无法通过重启CRS或者手动start该资源来使之ONLINE。我们来具体看一下什么情况下回产生这种资源?:

[oracle@rh2 ~]$ srvctl add service -h

Adds a service configuration to the Oracle Clusterware.

Usage: srvctl add service -d  -s  {-r "" 
[-a ""] [-P {BASIC | NONE | PRECONNECT}] | -g  
[-c {UNIFORM | SINGLETON}] } [-k   ] [-l [PRIMARY][,PHYSICAL_STANDBY]
[,LOGICAL_STANDBY][,SNAPSHOT_STANDBY]] [-y {AUTOMATIC | MANUAL}] [-q {TRUE|FALSE}] 
[-x {TRUE|FALSE}] [-j {SHORT|LONG}] [-B {NONE|SERVICE_TIME|THROUGHPUT}] 
[-e {NONE|SESSION|SELECT}] [-m {NONE|BASIC}] [-z ] 
[-w ] [-t ] [-f]
    -d       Unique name for the database
    -s              Service name
    -r ""    Comma separated list of preferred instances
    -a ""    Comma separated list of available instances
    -g            Server pool name
    -c {UNIFORM | SINGLETON} Service runs on every active server in the 
server pool hosting this service (UNIFORM) or just one server (SINGLETON)
    -k              network number (default number is 1)
    -P {NONE | BASIC | PRECONNECT}        TAF policy specification
    -l                 Role of the service (primary, physical_standby, logical_standby, snapshot_standby)
    -y               Management policy for the service (AUTOMATIC or MANUAL)
    -e        Failover type (NONE, SESSION, or SELECT)
    -m      Failover method (NONE or BASIC)
    -w              Failover delay
    -z              Failover retries
    -t              Edition (or "" for empty edition value)
    -j   Connection Load Balancing Goal (SHORT or LONG). Default is LONG.
    -B      Runtime Load Balancing Goal (SERVICE_TIME, THROUGHPUT, or NONE)
    -x   Distributed Transaction Processing (TRUE or FALSE)
    -q  AQ HA notifications (TRUE or FALSE)
Usage: srvctl add service -d  -s  -u {-r "" | -a ""} [-f]
    -d       Unique name for the database
    -s              Service name
    -u                       Add a new instance to service configuration
    -r        Name of new preferred instance
    -a       Name of new available instance
    -f                       Force the add operation even though a listener is not configured for a network
    -h                       Print usage

[oracle@rh2 ~]$ srvctl add service -d PROD -s maclean -r "PROD1,PROD2" -P BASIC

[oracle@rh2 ~]$ crs_stat|grep maclean
NAME=ora.prod.maclean.svc
NAME=ora.prod.maclean_taf.svc

[oracle@rh2 ~]$ srvctl add service -d PROD -s maclean_pre -r "PROD1,PROD2" -P PRECONNECT
[oracle@rh2 ~]$ crs_stat|grep maclean_pre            
NAME=ora.prod.maclean_pre.svc
NAME=ora.prod.maclean_pre_preconnect.svc

/* 可以看到仅当创建的service使用preconnect的TAF policy时会附带创建{service_name}_preconnect.svc的服务 */

[oracle@rh2 ~]$ srvctl start service -d PROD -s maclean    
[oracle@rh2 ~]$ srvctl start service -d PROD -s maclean_pre

[oracle@rh2 ~]$ crs_stat |grep -A3 maclean
NAME=ora.prod.maclean.svc
TYPE=ora.service.type
TARGET=ONLINE
STATE=ONLINE on rh2
--
NAME=ora.prod.maclean_pre.svc
TYPE=ora.service.type
TARGET=ONLINE
STATE=ONLINE on rh2
--
NAME=ora.prod.maclean_pre_preconnect.svc
TYPE=ora.service.type
TARGET=ONLINE
STATE=OFFLINE
--
NAME=ora.prod.maclean_taf.svc
TYPE=ora.service.type
TARGET=OFFLINE
STATE=OFFLINE

[oracle@rh2 ~]$ srvctl start service -d prod -s maclean_pre_preconnect
PRCD-1084 : Failed to start service maclean_pre_preconnect
PRCR-1079 : Failed to start resource ora.prod.maclean_pre_preconnect.svc
CRS-2674: Start of 'ora.prod.maclean_pre_preconnect.svc' on 'rh2' failed
CRS-2674: Start of 'ora.prod.maclean_pre_preconnect.svc' on 'rh3' failed
CRS-2632: There are no more servers to try to place resource 
'ora.prod.maclean_pre_preconnect.svc' on that would satisfy its placement policy

/* 无法手动启动该preconnect.svc服务 */

[oracle@rh2 ~]$ crs_stat |grep preconnect
NAME=ora.prod.maclean_pre_preconnect.svc

[oracle@rh2 ~]$ srvctl remove service -d PROD -s maclean_pre_preconnect
PRCD-1107 : Removed service maclean_pre_preconnect but failed to remove its 
underlying server pool PROD_maclean_pre
PRCS-1012 : Failed to remove server pool PROD_maclean_pre
PRCR-1072 : Failed to unregister server pool ora.PROD_maclean_pre
CRS-2554: Server pool 'ora.PROD_maclean_pre' cannot be unregistered as 
it is referenced by resource 'ora.prod.maclean_pre.svc'

[oracle@rh2 ~]$ crs_stat |grep preconnec

/* 以上remove命令报错但该preconnect.svc服务还是被删除了,虽然我们并不推荐这样做 */

[oracle@rh2 admin]$ srvctl start service -d PROD -s maclean_pre

[oracle@rh2 admin]$ lsnrctl service

LSNRCTL for Linux: Version 11.2.0.2.0 - Production on 30-MAR-2011 18:55:43

Copyright (c) 1991, 2010, Oracle.  All rights reserved.

Connecting to (ADDRESS=(PROTOCOL=tcp)(HOST=)(PORT=1521))
Services Summary...
Service "+ASM" has 1 instance(s).
  Instance "+ASM1", status READY, has 1 handler(s) for this service...
    Handler(s):
      "DEDICATED" established:0 refused:0 state:ready
         LOCAL SERVER
Service "PROD" has 1 instance(s).
  Instance "PROD1", status READY, has 1 handler(s) for this service...
    Handler(s):
      "DEDICATED" established:0 refused:0 state:ready
         LOCAL SERVER
Service "PRODXDB" has 1 instance(s).
  Instance "PROD1", status READY, has 1 handler(s) for this service...
    Handler(s):
      "D000" established:0 refused:0 current:0 max:1022 state:ready
         DISPATCHER 
         (ADDRESS=(PROTOCOL=tcp)(HOST=rh2)(PORT=36196))
Service "maclean" has 1 instance(s).
  Instance "PROD1", status READY, has 1 handler(s) for this service...
    Handler(s):
      "DEDICATED" established:0 refused:0 state:ready
         LOCAL SERVER
Service "maclean_pre" has 1 instance(s).
  Instance "PROD1", status READY, has 1 handler(s) for this service...
    Handler(s):
      "DEDICATED" established:0 refused:0 state:ready
         LOCAL SERVER
The command completed successfully
                                                                                                                           
[oracle@rh2 admin]$ tnsping PROD_TAF

TNS Ping Utility for Linux: Version 11.2.0.2.0 - Production on 30-MAR-2011 18:54:38

Copyright (c) 1997, 2010, Oracle.  All rights reserved.

Used parameter files:

Used TNSNAMES adapter to resolve the alias
Attempting to contact (DESCRIPTION = (ADDRESS = (PROTOCOL = TCP)
(HOST = rh-cluster-scan)(PORT = 1521)) (CONNECT_DATA = (SERVER = DEDICATED) 
(SERVICE_NAME = maclean_pre)))
OK (10 msec)


[oracle@rh2 admin]$ sqlplus  maclean/maclean@PROD_TAF

SQL> select instance_name,host_name from v$instance;

INSTANCE_NAME
----------------
HOST_NAME
----------------------------------------------------------------
PROD2
rh3.oracle.com

shutdown PROD2 instance:SQL> shutdown abort

SQL> select instance_name,host_name from v$instance;

INSTANCE_NAME
----------------
HOST_NAME
----------------------------------------------------------------
PROD1
rh2.oracle.com


/* 可以看到即使删除preconnect.svc服务也不会影响到TAF的正常使用,
    在生产环境中无需刻意去调试该服务,最好的应对方式是放任不管
*/

所以如果某天你看到你的crs_stat -t输出里有一条莫名的类似”ora….ect.svc ora….ce.type ONLINE OFFLINE”的记录,那么大可以忽略该资源的OFFLINE状态;这是正常现象,用不着紧张!

Diff Hidden Parameter between 10g and 11g


[gview file=”https://www.askmac.cn/wp-content/uploads/2010/03/Diff-Hidden-Parameter-between-10g-and-11g.pdf”]

隐藏参数_high_priority_processes与oradism

运行在操作系统上的进程存在2种系统时序优先级模式:即 实时模式 Real Time(RT) mode, 与分时模式 Time Sharing(TS) mode.
绝大多数Oracle进程运行在TS模式下:

[oracle@rh1 ~]$ ps -efc|grep ora_|grep -v grep
oracle    8510     1 TS   23 Mar27 ?        00:00:02 ora_pmon_PROD
oracle    8512     1 TS   23 Mar27 ?        00:00:00 ora_psp0_PROD
oracle    8514     1 TS   23 Mar27 ?        00:00:00 ora_mman_PROD
oracle    8516     1 TS   23 Mar27 ?        00:00:02 ora_dbw0_PROD
oracle    8518     1 TS   23 Mar27 ?        00:00:04 ora_lgwr_PROD
oracle    8520     1 TS   23 Mar27 ?        00:00:04 ora_ckpt_PROD
oracle    8522     1 TS   23 Mar27 ?        00:00:08 ora_smon_PROD
oracle    8524     1 TS   23 Mar27 ?        00:00:00 ora_reco_PROD
oracle    8526     1 TS   23 Mar27 ?        00:00:34 ora_cjq0_PROD
oracle    8528     1 TS   23 Mar27 ?        00:00:06 ora_mmon_PROD
oracle    8530     1 TS   24 Mar27 ?        00:00:07 ora_mmnl_PROD
oracle    8538     1 TS   23 Mar27 ?        00:00:00 ora_arc0_PROD
oracle    8540     1 TS   23 Mar27 ?        00:00:00 ora_arc1_PROD
oracle    8548     1 TS   23 Mar27 ?        00:00:00 ora_qmnc_PROD
oracle    8555     1 TS   23 Mar27 ?        00:00:00 ora_q000_PROD
oracle    8559     1 TS   23 Mar27 ?        00:00:00 ora_q001_PROD
oracle   30500     1 TS   23 22:10 ?        00:00:00 ora_j000_PROD

如上所示所有进程均运行在TS模式下且priority均为23|24.
Oracle一般不推荐使用RT模式,因为虽然个别进程可以通过这种方式获得更多的CPU资源,但往往系统的瓶颈并非CPU,即尽管CPU使用率高了,但实际系统TPS并未得到提升。
在10gr2版本后RAC中的LMS进程成为唯一一个使用RT模式的Oracle进程,我们可以通过查询参数_high_priority_processes了解相关信息:

SQL> col name format a40
SQL> SELECT x.ksppinm NAME, y.ksppstvl VALUE
  2   FROM SYS.x$ksppi x, SYS.x$ksppcv y
  3   WHERE x.inst_id = USERENV ('Instance')
  4   AND y.inst_id = USERENV ('Instance')
  5   AND x.indx = y.indx
  6  AND x.ksppinm LIKE '%priority%';

NAME                                     VALUE
---------------------------------------- ----------
_high_priority_processes                 LMS*
_os_sched_high_priority                  1

_high_priority_processes通过进程功能名进行匹配,下面我们将提高LGWR及PMON进程的优先级:

SQL> alter system set "_high_priority_processes"='LMS*|LGWR|PMON' scope=spfile;

System altered.

SQL> startup force;
ORACLE instance started.

Total System Global Area  281018368 bytes
Fixed Size                  2083336 bytes
Variable Size             150996472 bytes
Database Buffers          121634816 bytes
Redo Buffers                6303744 bytes
Database mounted.
Database opened.
SQL> !ps -efc|grep ora_|grep -v grep
oracle   31441     1 RR   41 22:50 ?        00:00:00 ora_pmon_PROD
oracle   31445     1 TS   23 22:50 ?        00:00:00 ora_psp0_PROD
oracle   31447     1 TS   23 22:50 ?        00:00:00 ora_mman_PROD
oracle   31449     1 TS   23 22:50 ?        00:00:00 ora_dbw0_PROD
oracle   31451     1 RR   41 22:50 ?        00:00:00 ora_lgwr_PROD
oracle   31455     1 TS   23 22:50 ?        00:00:00 ora_ckpt_PROD
oracle   31457     1 TS   23 22:50 ?        00:00:00 ora_smon_PROD
oracle   31459     1 TS   22 22:50 ?        00:00:00 ora_reco_PROD
oracle   31461     1 TS   23 22:50 ?        00:00:01 ora_cjq0_PROD
oracle   31463     1 TS   23 22:50 ?        00:00:01 ora_mmon_PROD
oracle   31465     1 TS   24 22:50 ?        00:00:00 ora_mmnl_PROD
oracle   31471     1 TS   24 22:50 ?        00:00:00 ora_p000_PROD
oracle   31473     1 TS   24 22:50 ?        00:00:00 ora_p001_PROD
oracle   31475     1 TS   24 22:50 ?        00:00:00 ora_arc0_PROD
oracle   31477     1 TS   22 22:50 ?        00:00:00 ora_arc1_PROD
oracle   31481     1 TS   23 22:50 ?        00:00:00 ora_qmnc_PROD
oracle   31488     1 TS   23 22:50 ?        00:00:00 ora_q000_PROD
oracle   31490     1 TS   23 22:50 ?        00:00:00 ora_q001_PROD
oracle   31500     1 TS   23 22:50 ?        00:00:00 ora_j000_PROD

好了lgwr和pmon进程也进入实时模式了,同时priority值上升到了41.
注意:
Oracle默认仅允许LMS进程(11g中多了VKTM进程)使用RT模式是有它的原因的,所以如果不是Oracle support 推荐,您没有任何修改隐式参数的理由。
其次根据Oracle文档[ID 602419.1]的描述,oradism文件(该文件位于$ORACLE_HOME/bin目录下)不正确的权限将导致RT模式无法被正确使用,该文件默认属于root用户并具有s权限。如下测试:

[oracle@rh1 bin]$ ls -la oradism
-r-sr-s---  1 root oinstall 14931 Mar 11  2008 oradism
[oracle@rh1 bin]$ su - root
Password:
[root@rh1 ~]# chown oracle:oinstall /s01/oracle/product/10.2.0/db_1/bin/oradism
[root@rh1 ~]# exit
logout
[oracle@rh1 bin]$ ls -la oradism
-r-xr-x---  1 oracle oinstall 14931 Mar 11  2008 oradism
[oracle@rh1 bin]$ sqlplus / as sysdba

SQL*Plus: Release 10.2.0.4.0 - Production on Sun Mar 28 23:07:03 2010

Copyright (c) 1982, 2007, Oracle.  All Rights Reserved.


Connected to:
Oracle Database 10g Enterprise Edition Release 10.2.0.4.0 - 64bit Production
With the Partitioning, OLAP, Data Mining and Real Application Testing options

SQL>
SQL> shutdown immediate;
Database closed.
Database dismounted.
ORACLE instance shut down.
SQL> startup;
ORACLE instance started.

Total System Global Area  281018368 bytes
Fixed Size                  2083336 bytes
Variable Size             150996472 bytes
Database Buffers          121634816 bytes
Redo Buffers                6303744 bytes
Database mounted.
Database opened.
SQL> col name format a35;
SQL> col value format a10;
SQL> SELECT x.ksppinm NAME, y.ksppstvl VALUE
  2   FROM SYS.x$ksppi x, SYS.x$ksppcv y
  3   WHERE x.inst_id = USERENV ('Instance')
  4   AND y.inst_id = USERENV ('Instance')
  5   AND x.indx = y.indx
  6  AND x.ksppinm LIKE '%priority%';

NAME                                VALUE
----------------------------------- ----------
_high_priority_processes            LMS*|LGWR|PMON
_os_sched_high_priority             1
SQL> !ps -efc|grep ora_|grep -v grep
oracle   31994     1 TS   23 23:07 ?        00:00:00 ora_pmon_PROD
oracle   31998     1 TS   23 23:07 ?        00:00:00 ora_psp0_PROD
oracle   32000     1 TS   23 23:07 ?        00:00:00 ora_mman_PROD
oracle   32002     1 TS   23 23:07 ?        00:00:00 ora_dbw0_PROD
oracle   32004     1 TS   24 23:07 ?        00:00:00 ora_lgwr_PROD
oracle   32008     1 TS   22 23:07 ?        00:00:00 ora_ckpt_PROD
oracle   32010     1 TS   23 23:07 ?        00:00:00 ora_smon_PROD
oracle   32012     1 TS   22 23:07 ?        00:00:00 ora_reco_PROD
oracle   32014     1 TS   23 23:07 ?        00:00:01 ora_cjq0_PROD
oracle   32016     1 TS   23 23:07 ?        00:00:01 ora_mmon_PROD
oracle   32018     1 TS   24 23:07 ?        00:00:00 ora_mmnl_PROD
oracle   32026     1 TS   24 23:07 ?        00:00:00 ora_arc0_PROD
oracle   32028     1 TS   23 23:07 ?        00:00:00 ora_arc1_PROD
oracle   32032     1 TS   23 23:07 ?        00:00:00 ora_qmnc_PROD
oracle   32045     1 TS   23 23:07 ?        00:00:00 ora_q000_PROD
oracle   32065     1 TS   23 23:08 ?        00:00:00 ora_q001_PROD
oracle   32072     1 TS   23 23:08 ?        00:00:00 ora_j000_PROD

that’s great, 显然oradism不仅为Oracle实例提供了内存资源控制功能,还包括了进程优先级分配的权限。
我们应当再次声明hidden parameter不应“滥用”于production environment.

沪ICP备14014813号-2

沪公网安备 31010802001379号