DB TIME1=DB CPU2+ Foreground NO-Idle wait time
1:Amount of elapsed time (in microseconds) spent performing Database user-level calls. This does not include the elapsed time spent on instance background processes such as PMON.
2:Amount of CPU time (in microseconds) spent on database user-level calls. This does not include the CPU time spent on instance background processes such as PMON.
10g中引入了基于时间统计信息的调优模型,其核心或者说最值得我们关心的大概是DB TIME和AASC 2项指标。DB TIME是Oracle在数据库层对用户级别(不包括后台进程的CPU和非空闲等待时间)各类操作耗时的一个总计,它直接反映了数据库前台的”工时”。DB TIME是否包含了前台进程在CPU队列上的等待时间呢,换而言之我们的命题是”Does DB TIME equal to DB CPU+Foreground NO-Idle wait time + DB CPU ON QUEUE ?”
让我们来看看以下测试:
[maclean@rh2 ~]$ cat /proc/cpuinfo |grep processor|wc -l
2
/*这是一台双核的pc服务器*/

打开session A:
begin
/* first one busy on cpu */
loop
null;
end loop;
end;
/*死循环调用NULL,会尝试独占一个逻辑CPU,没有其他等待事件*/

打开SESSION B:
begin
/* second one busy on cpu */
loop
null;
end loop;
end;

打开SESSION C:
begin
/* third one busy on cpu */
loop
null;
end loop;
end;

打开SESSION D:
SQL> exec dbms_workload_repository.create_snapshot;
PL/SQL procedure successfully completed.

/*手动收集AWR 快照*/

/*等待几分钟,以便收集信息*/

SQL> exec dbms_workload_repository.create_snapshot;
PL/SQL procedure successfully completed.
/*再次手动收集快照*/
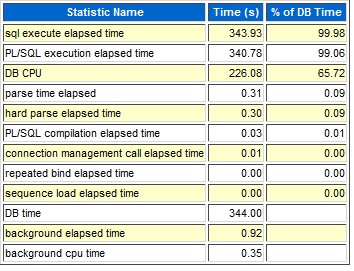
我们来看看AWR报告中的Time Model Statistics:

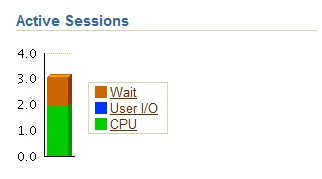
DB TIME为344s,而DB CPU为226s。以上匿名PL/SQL块仅引起CPU争用(不会产生其他前台等待事件),而这里DB TIME要远大于DB CPU,可见DB TIME=DB CPU+Foreground wait time+Cpu on queue; 我们也可以观察以下OEM界面上的AAS图形:
ASH报告也正确反映了这一事实,虽然它把cpu time和wait on cpu queue归并做了Cpu+wait for CPU:
![]()
可以看到CPU ON QUEUE有时被计为Wait time部分。当以上3个回话同时执行CPU敏感的匿名块过程时,其瞬时的Average Session Count为3,而该pc服务器上只有2个逻辑CPU,可以认为实例在该短期内存出现严重阻塞,表现到OS层也就是短期内持续队列较高。
[maclean@rh2 ~]$ vmstat 2
procs -----------memory---------- ---swap-- -----io---- --system-- -----cpu------
 r  b   swpd   free   buff  cache   si   so    bi    bo   in   cs us sy id wa st
 3  0      0 752180  93912 2127440    0    0   194   168  536  302  6  1 90  3  0
 3  0      0 752056  93912 2127508    0    0     0     0 1012  661 100  0  0  0  0
 2  0      0 751436  93928 2127548    0    0     0   932 1131  750 99  1  0  0  0
 2  0      0 751436  93928 2127596    0    0     0    16 1012  644 99  0  0  0  0
 2  0      0 751444  93928 2127596    0    0     0     0 1011  695 100  0  0  0  0


”Db time” Statistics Value is not Equal to the Sum of Children Statistic Times
Applies to:
Oracle Server – Enterprise Edition – Version: 10.2.0.1
Information in this document applies to any platform.
10.1.X 10.2.X
Goal
10gR2 Oracle Database Reference(7-48) says that the “DB time” value is equal to sum of item(1) to item (11), but actually the sum of all these statistics is greater than “DB time”.
We usually calculate the percentage as (specific statistic / DB time) * 100.
The total of the statistic percent is greater than 100% as you can see below:
Statistic Name Time (s) % of DB Time
sql execute elapsed time 29,906.1 78.3(1)
DB CPU 14,221.0 37.3 (2)
parse time elapsed 234.9 .6 (3)
sequence load elapsed time 145.3 .4 (4)
repeated bind elapsed time 16.1 .0 (6)
hard parse elapsed time 0.5 .0 (7)
PL/SQL compilation elapsed time 0.0 .0 (8)
Hconnection management call elapsed time 0.0 .0 (9)
failed parse elapsed time 0.0 .0 (10)
hard parse (sharing criteria) elapsed time 0.0 .0 (11)
DB time 38,177 N/A (12)
background elapsed time 859.5 N/A
background cpu time 487.0 N/A
PL/SQL execution elapsed time 19.7 .1 (5)
What can explain this difference ?
Solution
The statistic tree specified in the 10g official documentation means only that the child times are included into the Parent time, but not that the sum of the child times will be less or equal to their Parent.
This is due to some overlapping in the statistics times.
For example:
The ‘sql execute elapsed time’ overlaps with the ‘DB CPU’ time, as the SQL elapsed time is SQL CPU Time + SQL wait time.
Therefore, the comparison between the sum of child Times and the DB Time is not a valid comparison.
Hdr: 5105397 10.2.0.1.0 RDBMS 10.2.0.1.0 PRODID-5 PORTID-233
Abstract: DB TIME IS NOT EQUAL TO SUM OF ITS CHILD STATS IN V$SYS_TIME_MODEL
PROBLEM:
——–
This is a Documentation Bug logged for 10gR2 Oracle Database Reference
Oracle? Database Reference
10g Release 2 (10.2)
Part Number B14237-01
The relationships between the statistics listed in Table 7-4
10gR2 Oracle Database Reference(7-48) says the “db time” value is equal to
sum of item(1) ~ item (11), but actally the sum of all other statistics are
greater than “db time” as you can see in the following result.
STAT_NAME SECONDS
—————————————————————- ———-
DB time 620571
DB CPU 230091
background elapsed time 16072
background cpu time 2050
sequence load elapsed time 29
parse time elapsed 32564
hard parse elapsed time 30744
sql execute elapsed time 612132
connection management call elapsed time 138
failed parse elapsed time 21348
failed parse (out of shared memory) elapsed time 0
hard parse (sharing criteria) elapsed time 198
hard parse (bind mismatch) elapsed time 9
PL/SQL execution elapsed time 4544
inbound PL/SQL rpc elapsed time 0
PL/SQL compilation elapsed time 155
For example the sum of DB CPU and sql execute elapsed time is more
than DB TIME.
The summary is not 100% correct as some statistic times actually are
overlapping. For instance the ‘sql execute elapsed time’ overlaps with the
‘DB CPU’ time, as the SQL elapsed time is SQL CPU Time + SQL wait time.
I think it is necessary to update the next release documentation on this,
to inform users there is an overlap.
DIAGNOSTIC ANALYSIS:
——————–
The information specified in the 10g official documentation means only
that the child times are included into the Parent time, but not that the sum
of the child times will be less or equal to their Parent.
“DB time stat” is calculated in 100ths of a second after each database
call is completed. However, some other statistics are also calculated
for the same call. As they are individual statistics, the summary is not
100% correct as some statistic times actually are overlapping. For instance
the ‘sql execute elapsed time’ overlaps with the ‘DB CPU’ time, as the
SQL elapsed time is SQL CPU Time + SQL wait time.
So although the DB time is the parent of all childs given in the
documentation, comparison between SUM of child Times and DB Time isn’t
accurate at the end.
WORKAROUND:
———–
n/a
RELATED BUGS:
————-
REPRODUCIBILITY:
—————-
TEST CASE:
———-
STACK TRACE:
————
SUPPORTING INFORMATION:
———————–
24 HOUR CONTACT INFORMATION FOR P1 BUGS:
—————————————-
DIAL-IN INFORMATION:
——————–
IMPACT DATE:
————
To clarify this description, the following information has been added about
how to interpret the stats in Table 7-4:
The relationship between a parent and a child in the tree
indicates containment only. Please keep the following in mind with
regard to the tree:
Children do not necesarilly add up to the parent.
Children are not necessarily exclusive (that is, it is possible that they
overlap)
The union of children does not necessarily cover the whole of the parent.
This information will appear in the next posted review copy.
Statistic “Db Time” Different In The Various Wrh$ Tables
Applies to:
Oracle Server – Enterprise Edition – Version: 10.2.0.4
This problem can occur on any platform.
Symptoms
Statistic “DB time” different in the various WRH$ tables.
Statistic “DB time” captured from wrh$_sys_time_model:
11:54:10 prod1 >>l
1 select *
2 from sys.wrh$_sys_time_model
3 where stat_id = 3649082374
4 and instance_number = 1
5 and snap_id > 4734
6* order by 1
11:54:10 prod1 >>/
SNAP_ID DBID INSTANCE_NUMBER STAT_ID VALUE
———- ———- ————— ———- ——————–
4735 71443076 1 3649082374 145,838,170,816,937
4736 71443076 1 3649082374 146,112,519,730,052
====================================
====================================
Statistic “DB time” captured from wrh$_sysstat:
11:53:54 prod1 >>l
1 select *
2 from sys.wrh$_sysstat
3 where stat_id = 3649082374
4 and instance_number = 1
5 and snap_id > 4734
6* order by 1
11:53:54 prod1 >>/
SNAP_ID DBID INSTANCE_NUMBER STAT_ID VALUE
———- ———- ————— ———- ——————–
4735 71443076 1 3649082374 293,740,127,925
4736 71443076 1 3649082374 293,768,604,476
2 rows selected.
.
Cause
The one in sysstat does not properly conform to the definition of DB time (it includes some idle wait class time, but the DB time is defined to exclude it). This will be fixed in 11.2.
Solution
DB time from Time Model needs to be used.
Note that Time Model stat values are in microseconds, and sysstat DB time is in centiseconds. The numbers in v$sysstat are not going to match the AWR information (time model) and the AWR is the one to use.